September 14, 2021
Building Time Series Analysis on Snowflake with a Semantic Layer
AtScale’s partnership with Snowflake has dramatically expanded our customers’ data processing capabilities — guiding them toward analytics modernization. From delivering analysis-ready data to extending legacy tool services through dialect support, data practitioners can now deliver blazing-fast dimensional analysis to enable business-critical decisions.
In a panel discussion with Rob Saenz, Senior Sales Engineer at Snowflake, we took a deep dive into how combining the AtScale semantic layer with Snowflake’s easy-to-use and flexible cloud data warehouse solution eliminates the need for data marts and allows teams to run workloads entirely in the cloud.
Here’s a brief summary of what we covered during our presentation and product demonstrations.
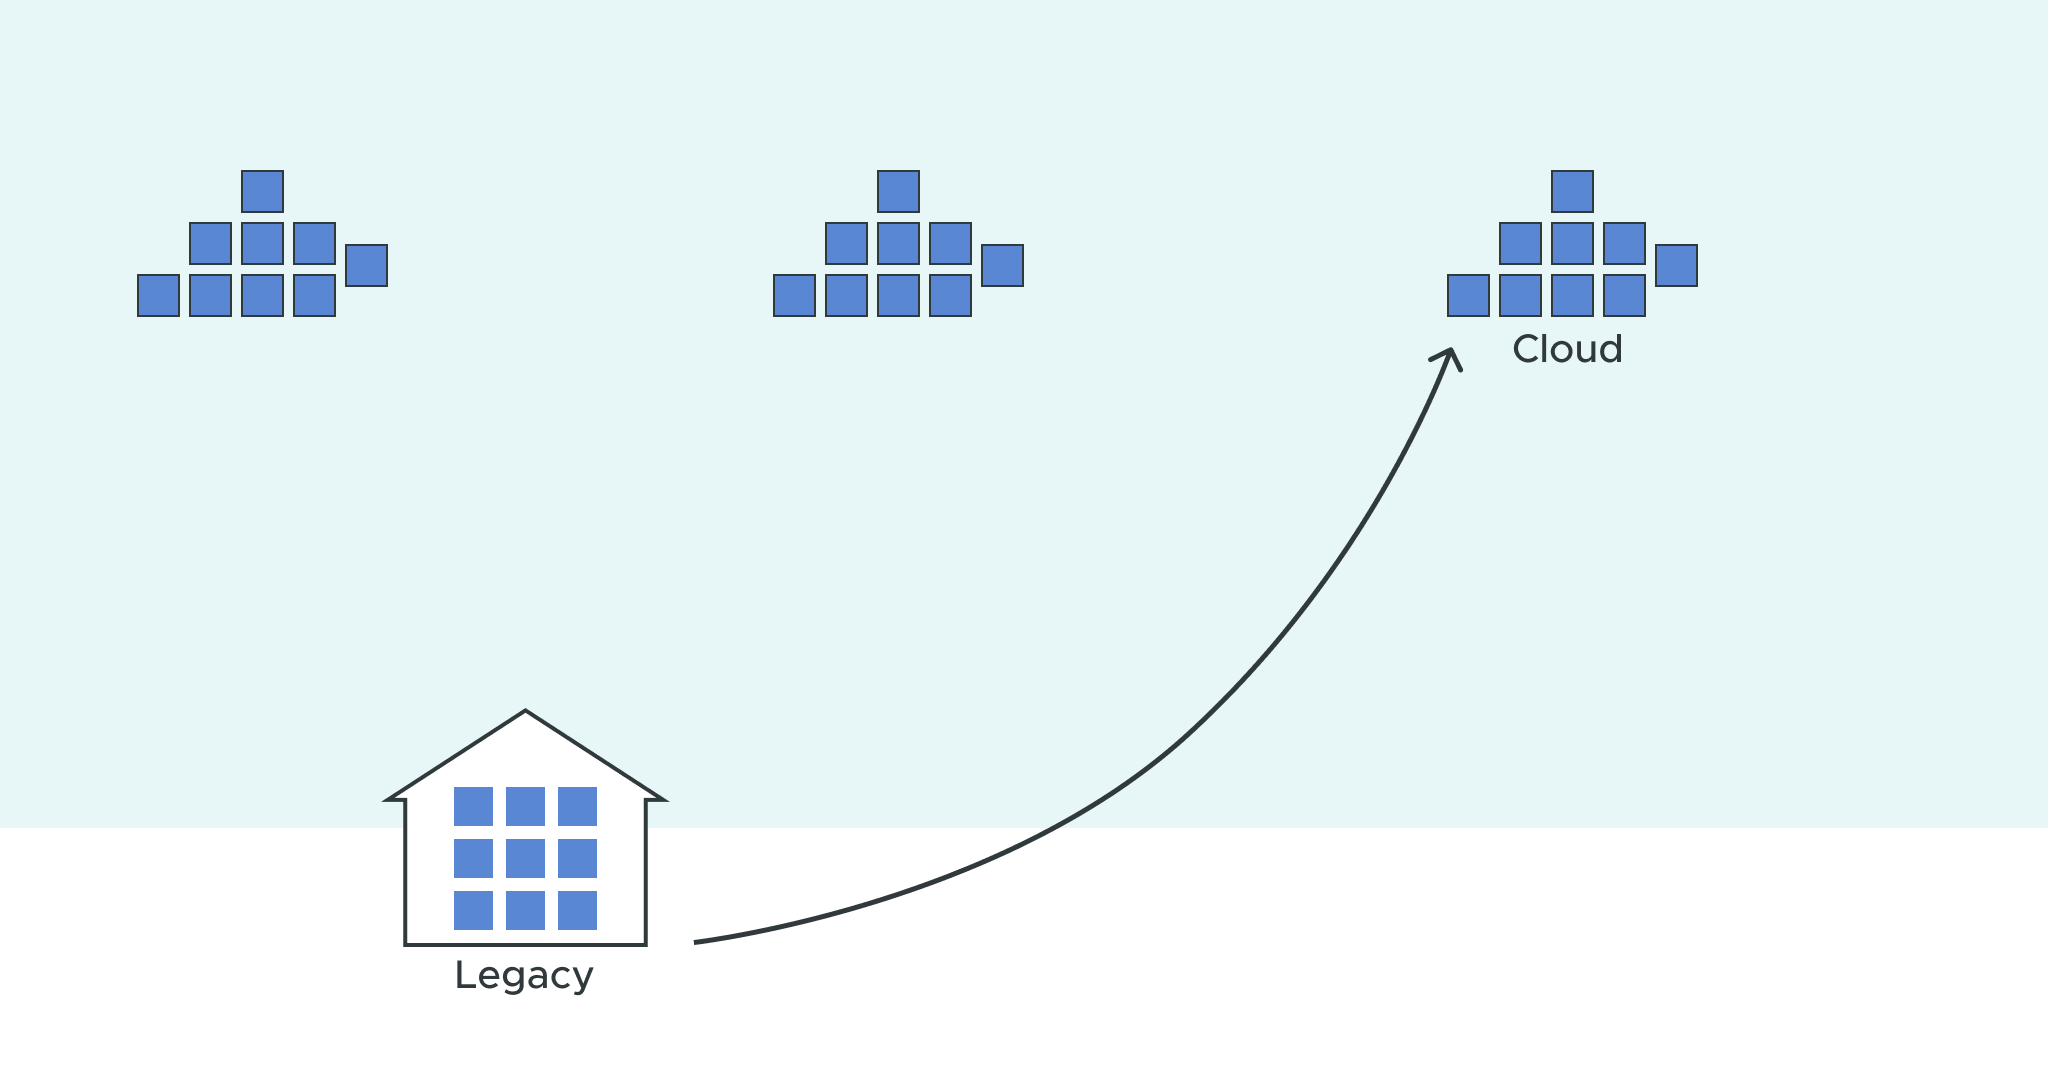
From legacy architectures to the cloud
To start the discussion, Saenz addressed the primary benefit of a cloud data warehouse like Snowflake: it provides a central system to connect businesses and data providers with relevant information. Additionally, the governance capabilities of the cloud architecture let you efficiently and securely utilize your data and quickly take action by only using information essential to each unique business user.
In terms of the requirements of a data cloud solution (which Snowflake uses as a framework), assuming an organization migrated from a legacy “cube” architecture, such as Microsoft’s SQL Server’s Analysis Services (SSAS), there still would need to be a unified platform with a single copy of the data that can simultaneously run concurrent workloads. There are also security requirements for cloud platforms to govern the access of data. In addition, cloud platforms have limited (to zero) system maintenance requirements and unlimited scalability.
Snowflake follows these principles with its four-tiered architecture design. At the base, the platform is cloud agnostic in that it will run in systems of major providers like Google Cloud, Amazon Web Services (AWS), and Azure while allowing portability between them. This capability is produced through the top tier of architecture — cloud services, which let users quickly convert commands or queries into actions such as a status check for a metadata warehouse.
There’s the next layer of architecture, known as multi-cluster computation, if additional steps require extra complex queries such as more nodes for a large warehouse. Users can define how much computing power they need to fulfill their requests. The final and middle layer is the centralized storage concept that ensures a single copy of data is stored, encrypted, and highly compressed — generating user confidence in Snowflake’s warehousing technology.
After discussing the ins and outs of Snowflake’s cloud architecture benefits and design, Saenz went over their vision of steering clear of data silos and having the ability to build multidimensional cubes for all business functions in one place. By gathering databases, enterprise applications, third-party software, the internet of things (IoT), and web data, organizations can produce value in a centralized way through data monetization, reporting, ad hoc analysis, and real-time analytics.
Speedy query performance
Once Saenz set the context by presenting the value of Snowflake’s cloud analytics, he took us through the journey of a use case using data from the New York Citi Bike bicycle sharing service. After going through the Snowflake interface and switching between different user roles, he showed the acceleration performance that could populate over 61 million ride records and create a table in only a few seconds using a simple command — conveying the accessibility of multidimensional analysis through fast data engineering.
To present a more expansive form of Snowflake’s functionality, he ran the same process but instead with semi-structured data. With the help of logic from the data set using a JSON process, he converted a single line of text into a readable table format, breaking down the number of biking trips by weather.
Simple semantic conversion with end-to-end support
Saenz then gave the mic to me to show some of the AtScale capabilities once you’re ready to add Snowflake data. Our platform had pulled the information from Snowflake with the objects already created and populated — making it easy to add them as data sources and pull the bike and weather tables using drag and drop onto the canvas. Like SSAS, you can have one or many fact tables and multiple dimensions, but they’re within the AtScale system instead.
You can change and republish your dimensions, calculations, and columns using the same logic and tested SQL syntax as Snowflake. Users can also configure specific hierarchies for their data and view it in a cube preview or as raw data to do any data cleansing. Once the model is ready, you can publish it — saving the model structure to AtScale’s server to connect with business intelligence (BI) software.
For complete end-to-end performance, AtScale will offer dialect support for dimensional interfaces such as data analysis expressions (DAX) and multidimensional expressions (MDX) code. With no data offloading or additional processing requirements, you can create aggregates natively on Snowflake that deliver data that’s ready for analysis with popular tools, such as Power BI, Excel, Tableau, and more.
Enabling dimensional analysis with AtScale’s semantic layer
AtScale’s single semantic layer between cloud data warehouses like Snowflake and your BI tools simplifies and streamlines your entire data processing workload. With multidimensional support, teams can access business-friendly data that is performance optimized through a single source of truth and a consistent governance system.
Be sure to watch our entire webinar and panel discussion: AtScale + Snowflake: Enable Dimensional Analysis in the Data Cloud. Also, check out our overview to learn in-depth about how a Snowflake semantic layer assists in dimensional modeling when paired with AtScale.


Power BI/Fabric Benchmarks