We’re living in an age where data drives organizational success. In the past, most organizations could get by with a central IT team doling out reports and dashboards to business users. That just doesn’t cut it anymore. The self-serve analytics revolution helped us move beyond this outmoded style of analytics delivery, but that was just scratching the surface.
The most advanced customers I work with today don’t think of data as just another asset, but instead treat data as their core product. But that’s advanced thinking and I still see a wide range of analytics delivery styles out in the wild.
The Data & Analytics Maturity Model
Customers are struggling to find the best way to reinvent their analytics practices and hyperscale data growth in the age of the cloud. When I talk to my customers about their data and analytics, I always get the same question: “What are your other customers doing?”.
In these fast changing times, customers are looking for ways to assess how well their organizations are doing compared to their peers. While there are numerous technical industry benchmarks for topics like database performance (think TPC), there’s not a whole lot on benchmarking organizational maturity for using data.
Given how far data has come and how fast it’s changing, there’s a clear need for a measuring stick for data and analytics maturity. In this post, I’d like to introduce the AtScale Data & Analytics Maturity Model, a framework for assessing where your organization sits on the analytics maturity scale and where you might aspire to be.

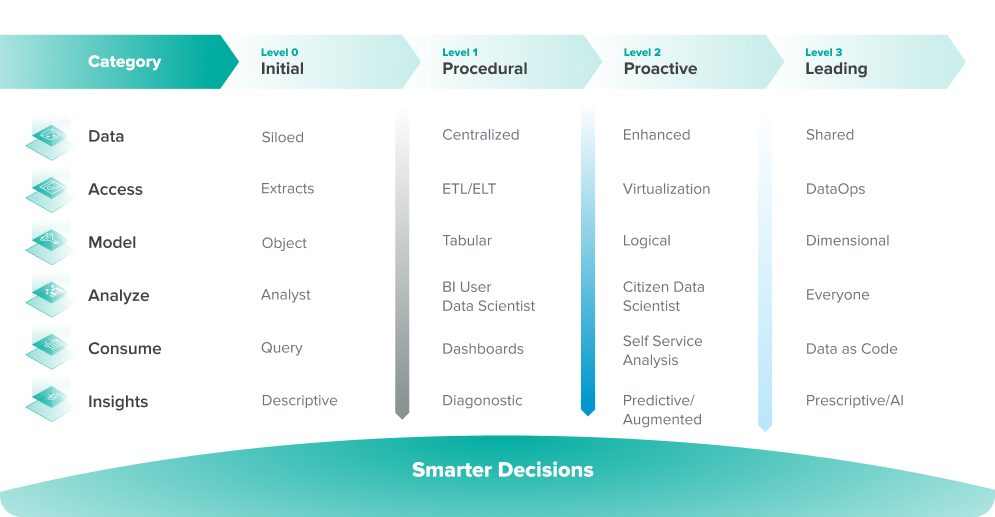
Image 1: The AtScale Data & Analytics Maturity Model
In the following sections, I will cover the six capabilities for building a data and analytics practice and four levels of maturity for each. From the most basic to the most advanced, you can use this data and analytics maturity model framework to assess your level of maturity to chart a course to the ultimate end state: empowering every person in your organization to make data-driven decisions at scale.
Capabilities of the Data & Analytics Maturity Model
When assessing where your organization sits on the maturity scale, we need to start by defining the stages and capabilities required to make data-driven decisions possible. In our maturity model, we define six capabilities starting with the “data” and ending with “insights”.
Data
Of course we have to start with the data. In this stage of the decision making process, we need to assess how and where we are storing data and what, if anything, we are doing to enhance it for consumption.
Access
Data is useless if users can’t access it for decision making. For the data access capability, we need to assess how we expose data to the business to support their requirements for atomic data access, timely access and access to both raw and normalized, cleansed data.
Model
Providing access to data without describing its contents is like driving at night without your headlights on. A business friendly data model is key to making data usable so we need to assess how we translate raw data into consumable information to support self-service.
Analyze
Who needs to access data and what skill level is required to be productive? The analyze stage of decision making is primarily concerned with the data consumer persona and their requisite maturity in using data for decision making.
Consume
There are several levels of sophistication for consuming data. For the consume capability, we need to assess how users are putting their data access to use and how they share their insights with others.
Insights
Insights are what lead to decisions so the insights capability is the critical final stage before making a data-driven decision. In this stage, we need to assess the processes and tools we use to transform data into actionable insights.
Levels of Maturity
It’s very unlikely that your organization will fit neatly into one of our four maturity levels. Rather, it’s more likely that your company spans different levels of maturity according to your organization’s capabilities. In this next section, I will delve deeper into these maturity levels, but keep in mind that they may not be a perfect fit. Use these level descriptions as a guide to assess where your organization can improve to ultimately reach Level 3.
Level 0: Initial
Organizations in the initial level of data and analytics maturity will tend to have an “every person for themselves” strategy toward data and analytics. Typically, each business unit chooses their own technical stack and data integration is performed on an ad hoc basis inside the business intelligence (BI) tools using the tools’ native import or extract functionality. Data will tend to be siloed in customized data marts or data may be accessed at the file level with little automation for refreshing analysis on a timely basis. For organizations at the initial level of maturity, analysis is typically left to those who have a fairly advanced skill level for writing SQL and wrangling data.
If you can answer “yes” to many of the following questions, your organization may fall into an Initial maturity level:
| Question | Yes | No |
| Does each business unit choose their own set of BI tools and data platform technologies and have their own data analyst team? | ||
| Do BI users rely on data extracts or data imports to author reports or perform exploratory analysis? | ||
| Do BI users define calculations and model data inside their BI tools with minimal sharing across teams? | ||
| Does your company have a “Data Analyst” job title and is it the responsibility of this job function to author reports and dashboards for others? | ||
| Do users need to have advanced SQL skills to perform analysis? | ||
| Do most reports and dashboards focus on backward looking events (revenue last month, etc.)? |
Level 1: Procedural
Organizations at the procedural level of data and analytics maturity will tend to have a centralized BI or data team that’s responsible for curating and loading a corporate data warehouse. This centralized data team will tend to be staffed with data engineers who use a variety of commercial and home grown ETL/ELT tools for transforming raw data into database tables. At this level, it’s likely that the central data team dictates the toolsets for analyzing data, including BI and AI tools. Business users and data scientists will often be dependent on this central data team for getting access to new datasets and be subject to a development or roadmap queue. Business users are usually responsible for authoring their own reports using a star schema defined by the central data team in the data warehouse.
If you can answer “yes” to many of the following questions, your organization may fall into a Procedural maturity level:
| Question | Yes | No |
| Is there a central data or BI team that’s responsible for designing and loading a data warehouse or data marts for the business? | ||
| Is the business user or data scientist responsible for creating their own reports and models using a relational database model? | ||
| Is there some level of standardization for BI and AI tools selection? | ||
| Is access to new data sources subject to prioritization and project-based delivery by a central data team? | ||
| Do users need to have at least basic SQL skills to perform analysis? |
Level 2: Proactive
Organizations at the proactive level of data and analytics maturity have typically advanced beyond just providing carefully curated data access and have introduced more atomic level, user driven data access. By augmenting their ETL data pipelines with data virtualization tools, organizations at this level can be more agile in responding to the business data needs by providing more self-service data access. The more advanced organizations at this level may augment their first party data with third party data to provide richer datasets for deeper insights. In addition to providing self-service access for business users, organizations at the proactive level may support AutoML tool access so that citizen data scientists can create predictive models for improving business forecasts and customer experience.
If you can answer “yes” to many of the following questions, your organization may fall into a: Proactive maturity level:
| Question | Yes | No |
| Does the organization use data virtualization technologies in addition to traditional data movement strategies for data integration? | ||
| Do business users and data scientists have access to atomic level data on demand? | ||
| Does the organization support AutoML tools and data science projects beyond just the expert data scientist persona? | ||
| Does the organization augment raw data with third party data enhancements and advanced calculations? | ||
| Do users need to have at least basic SQL skills to perform analysis? |
Level 3: Leading
Organizations at the leading level of data and analytics maturity typically have introduced a business-oriented semantic layer to simplify self-service data access to most, if not all, enterprise data. At this level, data analysis is no longer suitable just for advanced data analysts and data scientists. Instead, anyone in the organization can use data and analytics to make data-driven decisions using the tools and interfaces of their choice. To drive analytics consistency, promote data governance and simplify data access, organizations at the leading level leverage a semantic layer in their data technology stack. With a semantic layer, analytics are not just limited to BI and AI tools but are also embedded in applications and shared both inside and outside the company with strategic business partners.
If you can answer “yes” to many of the following questions, your organization may fall into a: Leading maturity level:
| Question | Yes | No |
| Does the organization standardize data access using a unified, business friendly semantic layer? | ||
| Is data used by people in the organization to make decisions who don’t have the term “data analyst” or “data scientist” in their job title? | ||
| Does the organization share data with business partners? | ||
| Does the organization support consistent, multi-mode data access in a variety of business intelligence tools (including Excel), AutoML tools and applications? | ||
| Does the organization enforce consistent data governance policies and promote data literacy for everyone? | ||
| Does the organization leverage data and analytics to autonomously improve business performance and customer experiences? |
Summary
I hope you find the above data and analytics maturity model framework useful in understanding how your organization rates on the analytics maturity scale. More importantly, I hope you can use this tool as a roadmap to improving each of the core data and analytics capabilities for your organization. No matter how you get there, taking these steps will help you build a data-driven culture that will translate into better business outcomes.
In my next post, I will talk about how to leverage this maturity model to create an analytics flywheel effect to further improve the velocity of your organization’s decision making. Until then, keep your data fresh and your analytics sharp.
Upcoming Webinar:
How are fellow data and analytics leaders are building a self-service, data-driven culture that scales on their cloud data platforms? Join us and leaders from General Mills, Affinity and EverQuote to learn how!


SHARE
The Practical Guide to Using a Semantic Layer for Data & Analytics