Curated advice from 50+ data leaders, industry experts & customers
Over the last 12 months, we’ve hosted 18 webinars with 50+ industry experts, data leaders, and customers reaching an audience of 25k+ data and analytics community members/professionals.
I’ve decided to do a 3 part series recapping some of the best actionable insights I’ve learned from these experts. These posts will center around three core themes that have emerged over the past year; aligning AI & BI teams to business outcomes, scaling self-service analytics, and optimizing cloud analytics for scale.
Let’s dive into the second post:
Realizing Self-Service Analytics on Snowflake
When I spoke to Kevin McGinley, technical director of SnowCAT at Snowflake, at our webinar on How to Democratize Data Across Your Organization With a Semantic Layer, he shared the perspective of how Snowflake thinks about self-service analytics.
In the early stages of Snowflake, the company was doing everything it could to help customers reach the peak of the maturity curve with data warehouse approaches but quickly experienced some classic pain points. Their customers ran into problems with fixed capacity, the limitations of only handling highly structured data, and had to maintain logic and data access spread across multiple BI tools.
As the public cloud emerged, the founders at Snowflake took a hard look at these challenges and developed a tool to address those pain points. That’s the origin of the Snowflake platform, which was built on top of the public cloud to take advantage of elasticity, automation, and data access across regions. As data science and business analytics took shape to become the core business differentiator that it is today, their customers naturally led them down a path to the Data Cloud concept. A global, unified system that connects companies and data providers through the Snowflake platform, which allows Snowflake customers to share data without costly or complex data transfers.
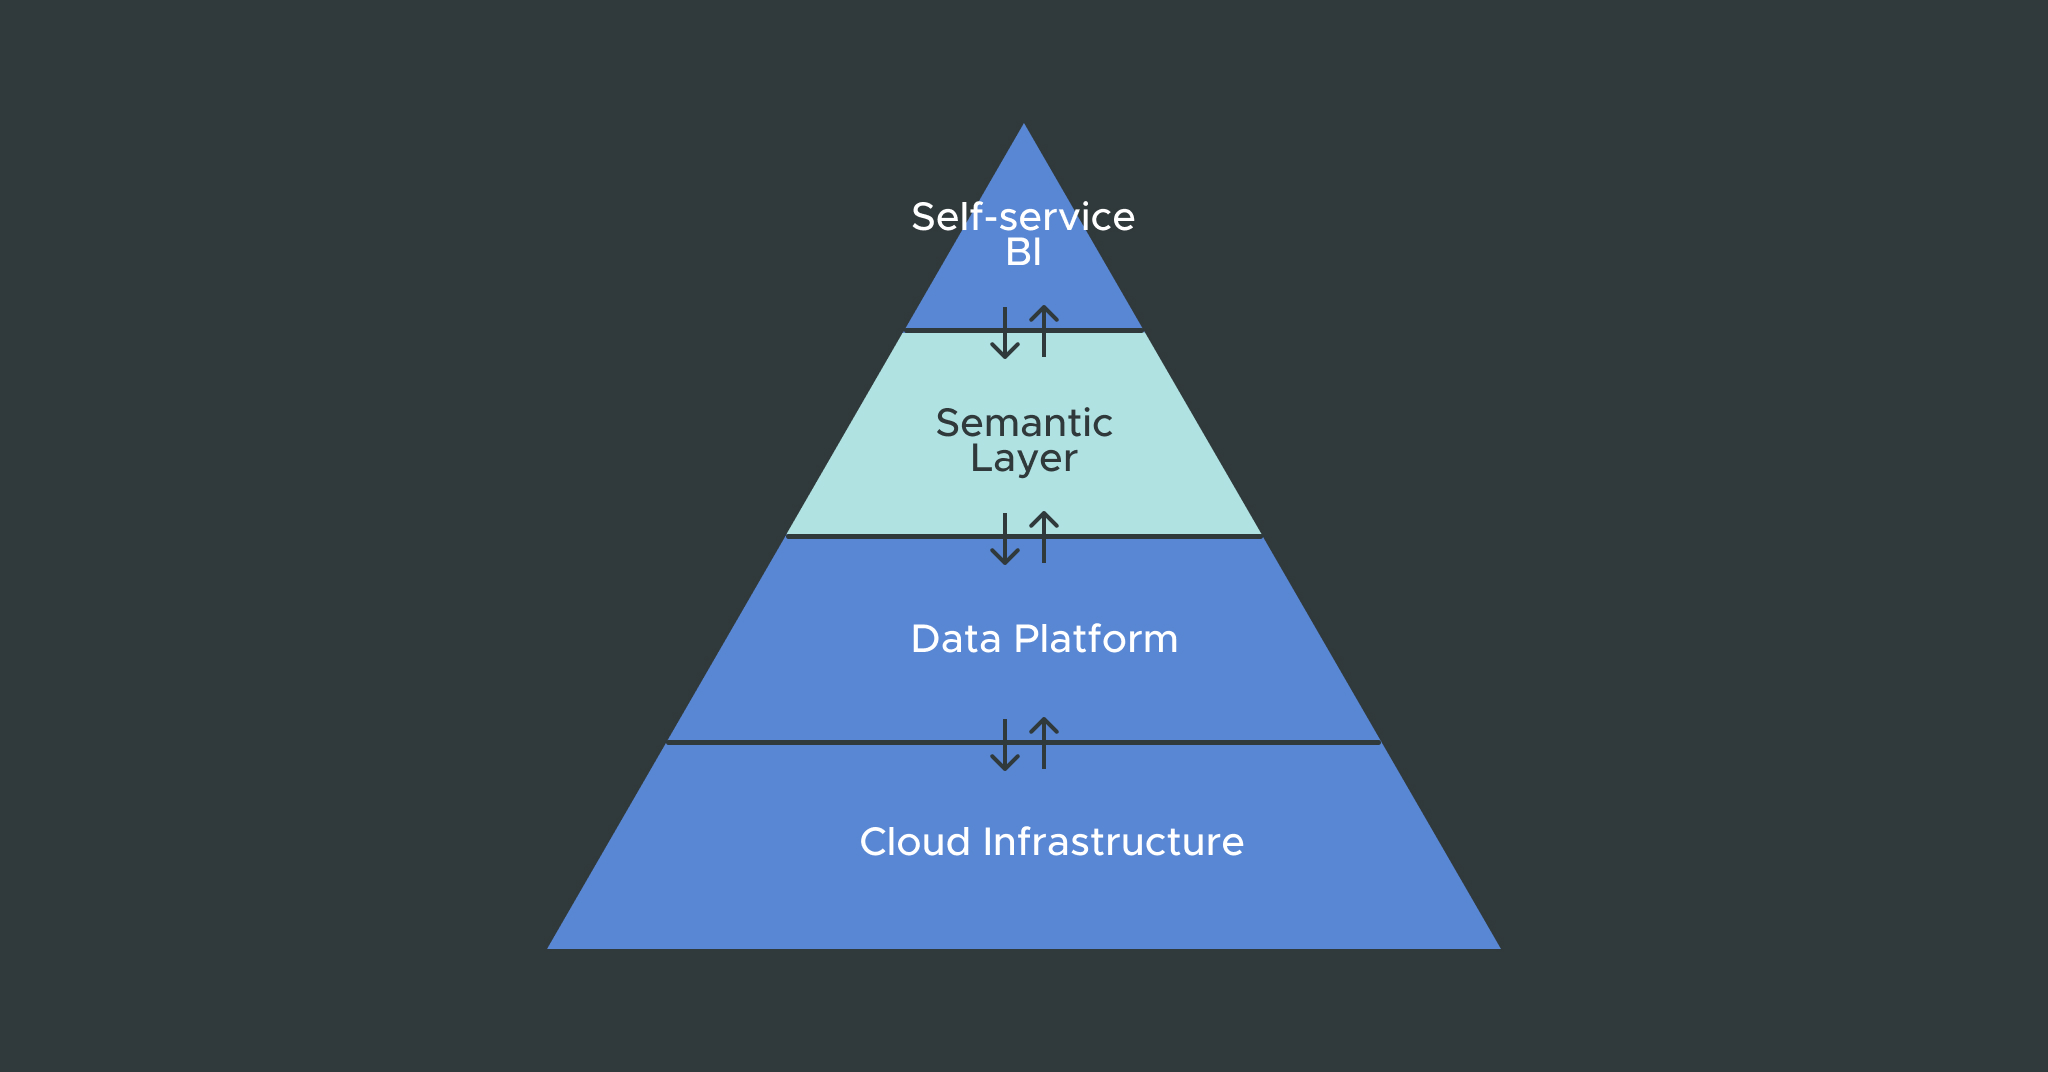
While this platform brings tremendous business value to the company and customers, it also brings an equally immense amount of data sources and tables to manage. These different domains and sources drive the adoption of various BI tools, each with its own logic, visualizations, and version of the truth. They see the advantages of AtScale’s Semantic Layer to connect BI workloads to the underlying data tables, which eliminates a lot of the pain points of trying to deliver self-service BI. AtScale simplifies extracting actionable intelligence from raw Snowflake data while significantly improving query and analytics performance for users regardless of which BI tool they choose. It helps them provide a clear, consistent single source of truth for all of their data.
What Does AWS See Their Most Successful Customers Doing with Their Data Projects?
During our webinar on How to Make Data & Analytics Consumable for Everyone in an Organization, I asked Chris Chapman what he observes from his perch at AWS about how customers execute their data projects. One observation he shared that stuck with me is how specialized tools and specialized skills are required for data projects to eventually yield business value at every stage of the data life cycle. In most companies, it’s very challenging to find an expert for every tool and every step of the life cycle. The best data toolsets remove barriers to data access and enable all teams to access the information and visualizations they need with minimal effort.
If companies want to offload their data science and BI teams to focus more on predictions and value-driving analytics, they need self-service for all popular tools across the data science and BI workflows. They need clear, clean, and validated data viewable through a single source regardless of how many underlying data sets or sources they manage. Many top-performing data projects connect their data sources to Amazon Redshift and use a semantic layer to unify models, views, and governance from their BI tools to deliver self-service cloud-based analytics across their companies.
How Does Tyson Foods Leverage Cloud Analytics to Scale Smarter Data-driven Decisions?
We hosted a webinar to discuss Tyson Foods’ digital transformation journey to build a connected, data-driven organization. Chad Walquist, Director of Data Strategy and Technology at Tyson, shared some great insights into how they invested in automation, innovation, and cloud-native tooling to optimize cloud analytics in their company. Tyson made heavy use of OLAP-based solutions because of their ability to provide a multidimensional, business-friendly view for their data. As the company tried to scale up its data capabilities, its OLAP approach led to fragmented data silos spread across legacy data lakes and other platforms. They shifted to Hadoop but quickly found that Hadoop didn’t work well with OLAP. Though they eventually moved to RedShift and Google BigQuery for their underlying architecture, AtScale’s semantic layer bridged the gap between their distributed data sources and allowed them to continue using their preferred BI tools like Tableau with a multidimensional interface.
Stay Tuned for More Webinar Content and Partner Insights
That wraps up my second recap of the best insights from our 18 webinar panels. For more, check out the resource center to see all of the webinar topics and featured guests.


SHARE
The Practical Guide to Using a Semantic Layer for Data & Analytics