
How to Create, Deploy & Connect Your First Model on the AtScale Developer Edition

Overview:
Now that you have the Developer Edition of AtScale up and running, we will look at how to connect a business intelligence tool and run a query against AtScale. In the AtScale Developer Edition, there are three pre-installed tutorial data models, so new users can start querying immediately.
In this article, we’ll look at how to do that using Tableau.
Prerequisite:
- Assume you have installed AtScale Developer Edition.
- Assume you have installed Tableau.
Create and Deploy a Data Model
- Open AtScale.
- Click the ellipsis next to the AtScale icon at the top left of your screen.
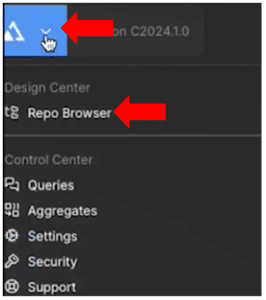
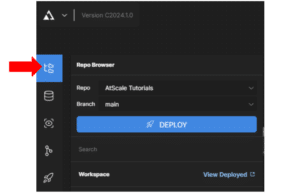
- Under Design Center, select Repo Browser. Alternatively, simply click the Repo Browser icon.Note: The Repo Browser contains the source code for the models and the modeling effort.
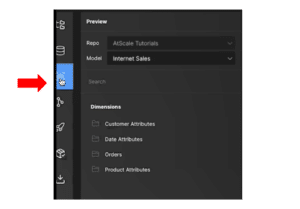
- Click on the Preview tool. This will show you what users will see when they open a business intelligence tool like Tableau and connect to AtScale.
Note: When you first open AtScale, this is where you will see the AtScale and the tutorial three data models — Internet Sales, TPC-DS Benchmark Model, and Worldwide Importers.
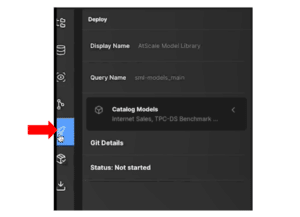
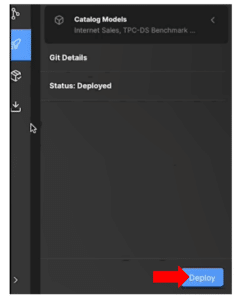
- In order to query an AtScale model, you must first deploy it. To do this, click the Deploy icon. You will see the Query Name “sml-models_main”, and the three tutorial models in the Catalog Models field.
Note: When you build your own models, you must deploy them before they can be queried. Similarly, if you’re working or editing a model, you will need to deploy in order for those changes to be seen by the BI tool.
- Click the Deploy button at the bottom of the panel. When AtScale has prepared the three models to be deployed, Deploy Successful should appear at the bottom right of your screen.
Connect Your Models to Your BI Tool
- Click on the Deployed catalogs icon in the left sidebar.
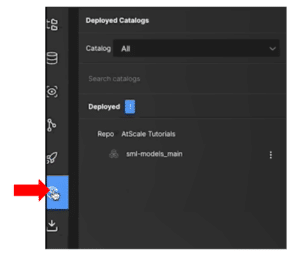
- Double-click on sml-models_main. This will bring up all the connection information to use to connect a BI tool to these AtScale models.
Note: JDBC, MDX, and ODBC & SQL connection strings will be displayed.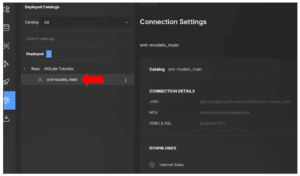
- Under Downloads, you will see the Tableau Data Source (TDS) files for the three tutorial data sets. Click on the .tds download button of the dataset you want to work with.

- In the Save As field, you can change the file name. Select the location to save the file and click Save. The .tds file will now download.
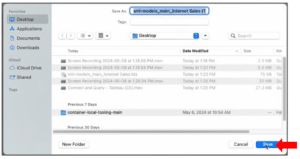
- From your downloads folder, or the saved file location, open this .tds file.
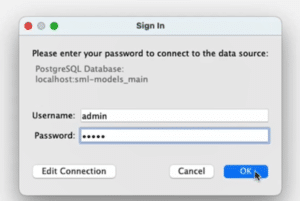
- The Tableau sign-in panel will open. Type in the username “admin”.
- Type in the same password you use to log in to AtScale Developer Edition.
Note: When you set up AtScale Developer Edition, you were prompted to change the admin password. This is the password you should enter here.
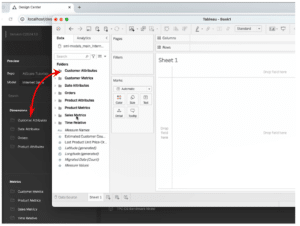
- Tableau will now open up on a new page.
Note: Notice that the folders in the left sidebar correspond to the Preview screen in AtScale.
Run Your First Query
- From the Folders menu in Tableau, expand a data folder by clicking the ellipsis. Here, we will use the Sales Metrics folder.
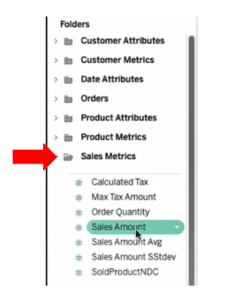
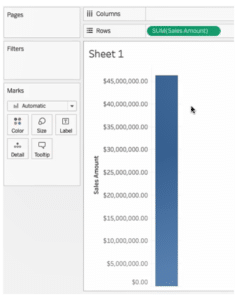
- Click on the metric you want to query and drag it to the Rows or Columns field, depending on how you want your query to be displayed. Here, we have dragged the Sales Amount into the Rows field.
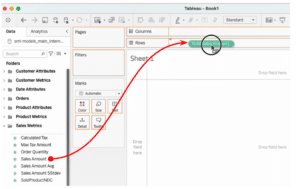
- Your query will now run against the AtScale data, and the data (here, Sales Amount sum) will be displayed in the Tableau sheet.
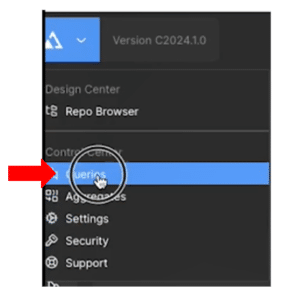
- To see how the query is reflected in AtScale, go back to AtScale Developer Edition and click the ellipsis next to the AtScale icon. Select Queries.
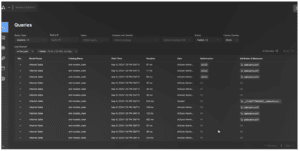
- This will display a list of all the queries that have been run against the data model.Note: If you have just run a query, you may need to refresh the page to see that query displayed. It can be a useful practice to move back and forth between your BI tool and AtScale to monitor the details and performance of your data models.
Congratulations! You’ve now run your first query in AtScale Developer Edition.

