Many companies struggle with making data available quickly and structured in a way to enable the generation of actionable insights, particularly using a self-service delivery model. As the amount of data available via modern data platforms and sources continues to grow, companies need to ensure that their data is available, accurate, actionable and automated.
This blog reviews the current challenges with making data available and actionable using a self-service delivery model, and discusses the capabilities AtScale provides to support a broad array of self-service analytics. Using a common semantic layer addresses self-service data access, profiling, preparation, integration, aggregation and publishing for insights and analytics – enabled and accelerated by AtScale.
A Smarter, Faster Path to Self-Service Business Intelligence
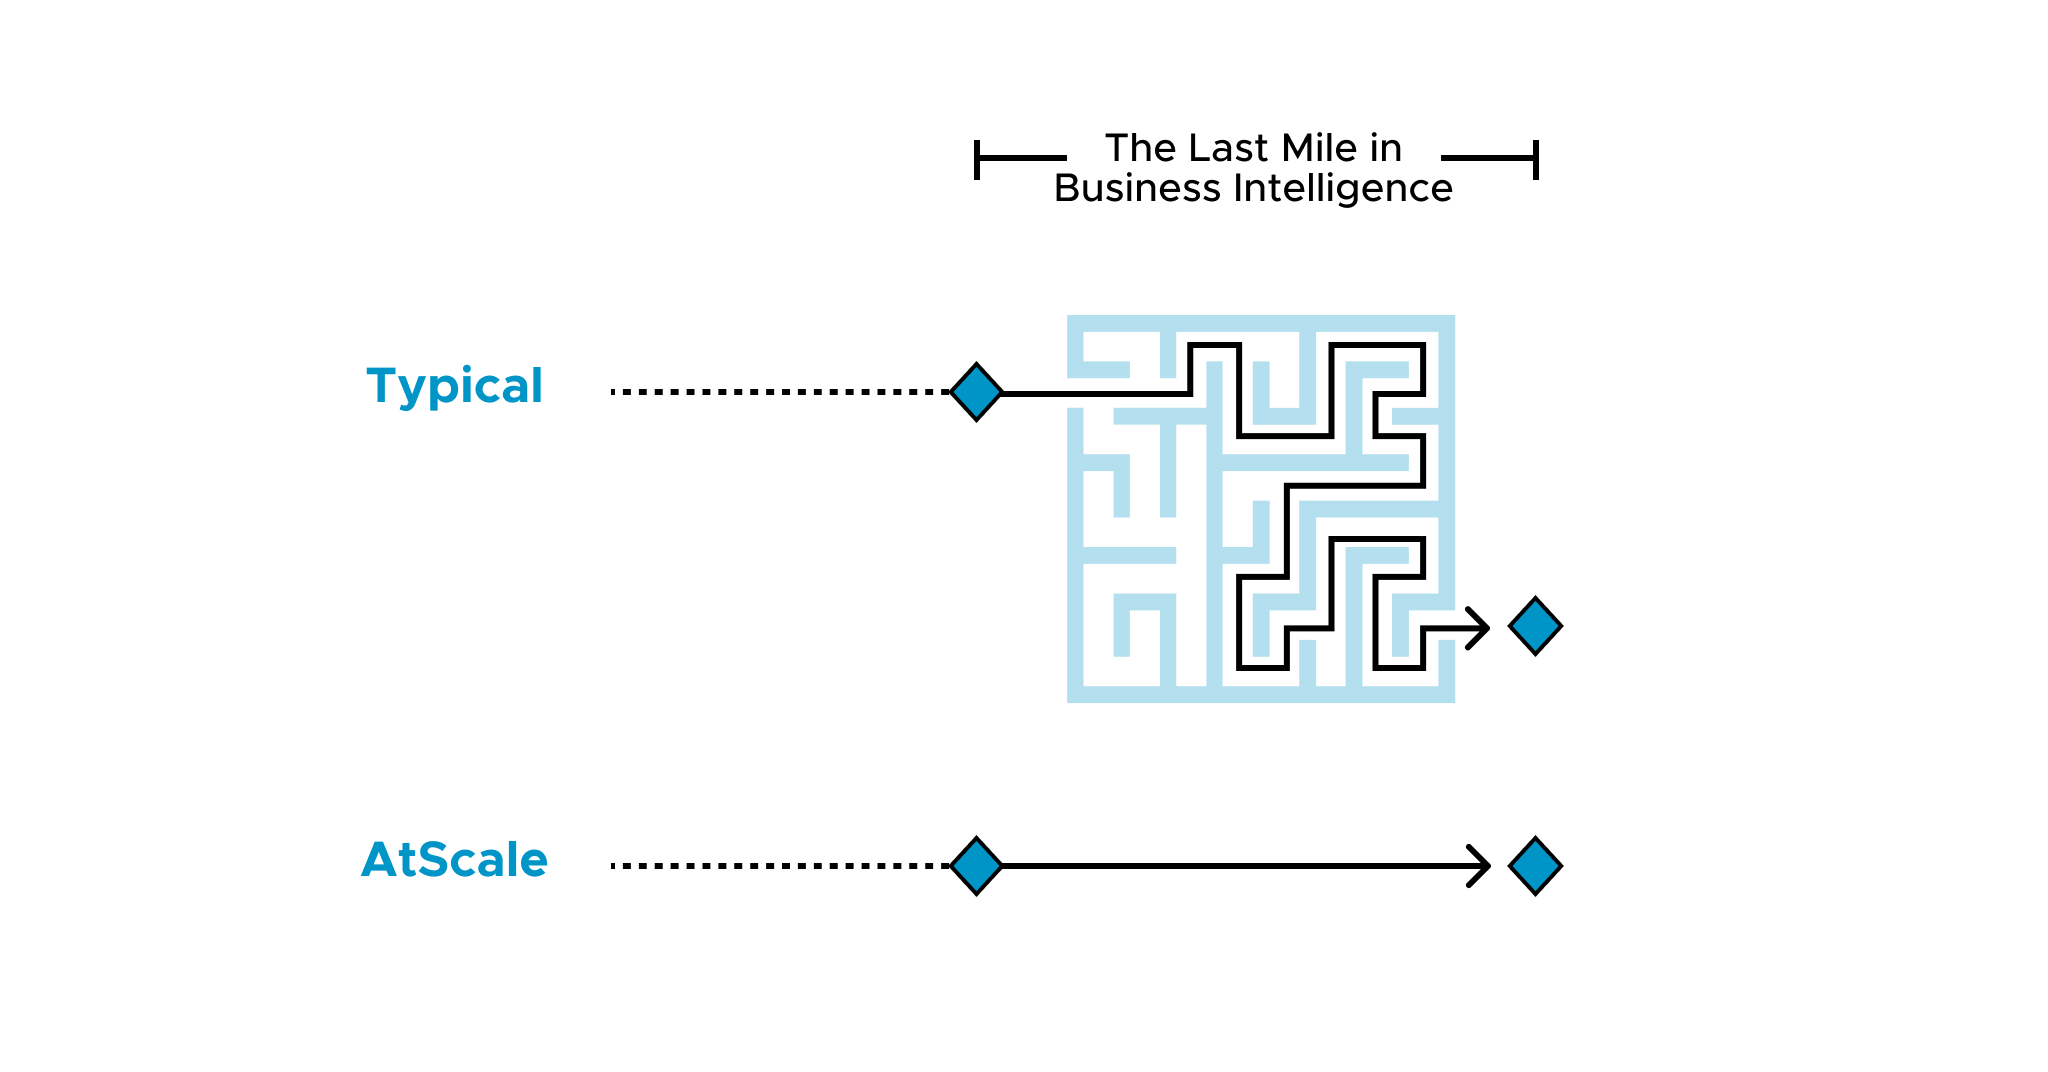
The improved use of data, insights and analytics is driving companies toward modern cloud platforms. Many realize that the “last mile” of preparing, analyzing and publishing insights, which is the data consumption layer for Business Intelligence, takes too long to create, refresh and refine. The biggest limitations are as follows:
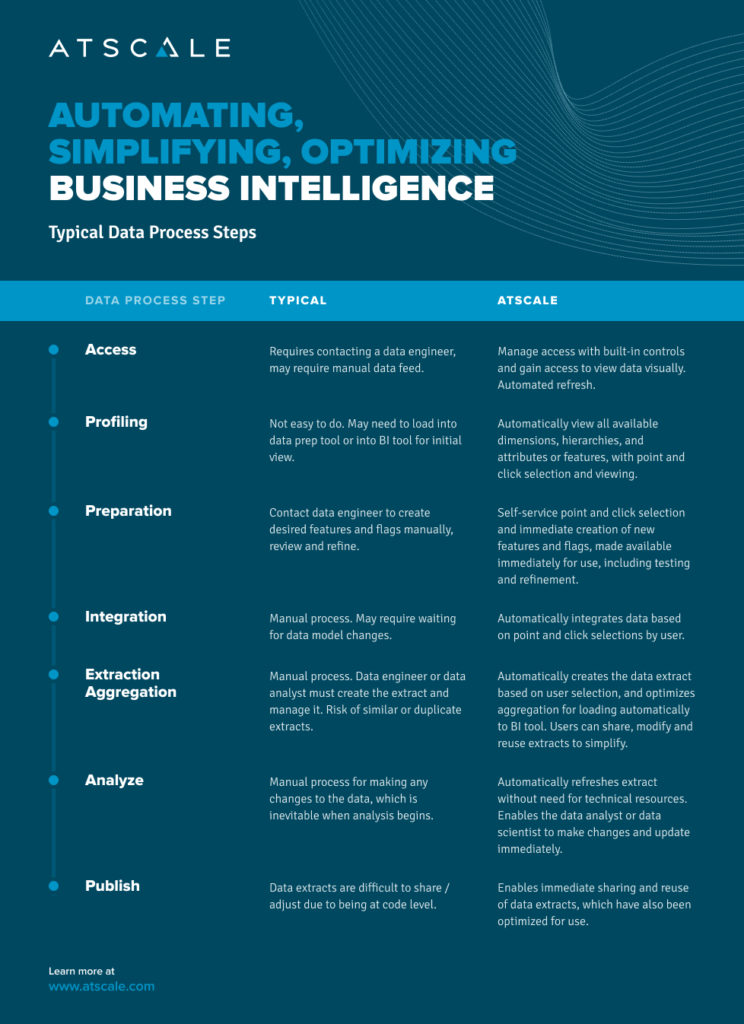
- Self-Service – There is a lack of tools to enable rapid self-service for all aspects of data preparation and publishing to support business intelligence. These data self-service activities include access, governance, profiling, preparation, integration, aggregation, publishing and ongoing refresh operations. Some tools address pieces of the entire process, such that many tools may be required, which often adds complexity for users.
- Manual Coding – Making data available for business intelligence tools and uses often requires data engineering resources, which are involved with data availability, data structuring and data pipeline creation for consumption. In addition, there is the need for ongoing refinements, maintenance and operation. This work typically requires manual coding.
- Governance – There is typically a lack of analytics governance across the entire process. Governance may be in place to manage data access, but is often lacking to support data integration, new feature creation, aggregation and publishing for consumption.
Collaboration and Sharing – The process for making data available for business intelligence consumption is often single-threaded through individual data analysts. That means there’s a lack of ability to review prior data pipelines built, collaboration and sharing. Reuse is often lacking as well, causing increased complexity in terms of number of individual data integrations and pipelines to manage.
Self-Service Automation: Data Preparation and Consumption for Business Intelligence
AtScale has created a solution that automates and simplifies the process for making data available for business intelligence, including to BI tools like Tableau, Power BI and Excel. Data analyst, data scientist or data engineer can visually select the dimensions, hierarchies and attributes or features desired, and AtScale automatically creates the data extract for loading into the BI tool immediately. Given that many BI tools cannot handle atomic-level data, AtScale also automatically optimizes the aggregation of the data to ensure that reports generated within BI tools are effective. Finally, AtScale automates the entire process with no coding required, so self-service is enabled with point and click simplicity. This includes supporting self-service data refinement, sharing or reuse, and governance of data access, preparation and consumption.
Let’s look at how AtScale enables self-service data preparation, aggregation and governance for business intelligence that’s visual, point and click with no code, yet automatically refreshed and available to share with other users, including with data governance. Typical users who enjoy self-service BI capabilities from AtScale are data analysts, data scientists and data engineers.

The Key to Business Intelligence Automation – AtScale Semantic Layer
AtScale’s semantic layer solution gives the ability to visually manage data, including attributes, metrics and features in dimensional form. This can then be cleaned, edited, refined by adding additional features, and automatically extracted and made available to any BI tool, whether it’s Tableau, Power BI or Excel. This only requires one resource who understands the data and how it is to be analyzed, reducing complexity and the need for a lot of resources., This also eliminates multiple data hand-offs, manual coding, risk of duplicate extracts and suboptimal query performance.


SHARE
Case Study: Vodafone Portugal Modernizes Data Analytics