
Congratulations! Your data is controlled, aggregated and turbocharged in your AtScale virtual cube. You have Tableau to create remarkable visualizations. Your data is happy! But are your cube designers and business users too? For instance, did you know that centralizing calculations in your AtScale Virtual Cube eliminates TDE perpetuation, 3rd party ETL processes and version control headaches? For an enhanced AtScale experience, here are 5 Best Practices you should be implementing in order to maximize AtScale on Tableau.
Join Jen Underwood to Learn Best Practices on Deploying Data Analytics Strategy
Best Practice 1: Avoid Using Calculated Fields in Filters
When defining Tableau Filters you should avoid using calculated fields (Tableau Calculated Field, Atscale Calculated Column/Measure) that evaluate every source row. In the following example, Order Year and Order Quarter are concatenated as strings and then converted to integers so the field can be used in a filter range.

To retrieve values since 2007 Q1 we drag this field to the Filters card and set the following Condition Formula:
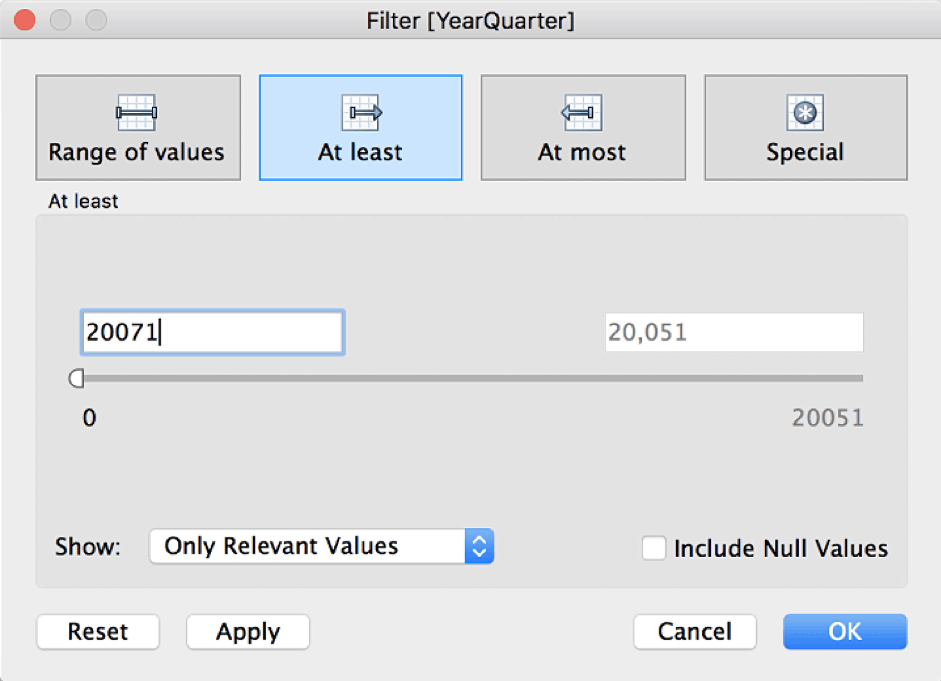
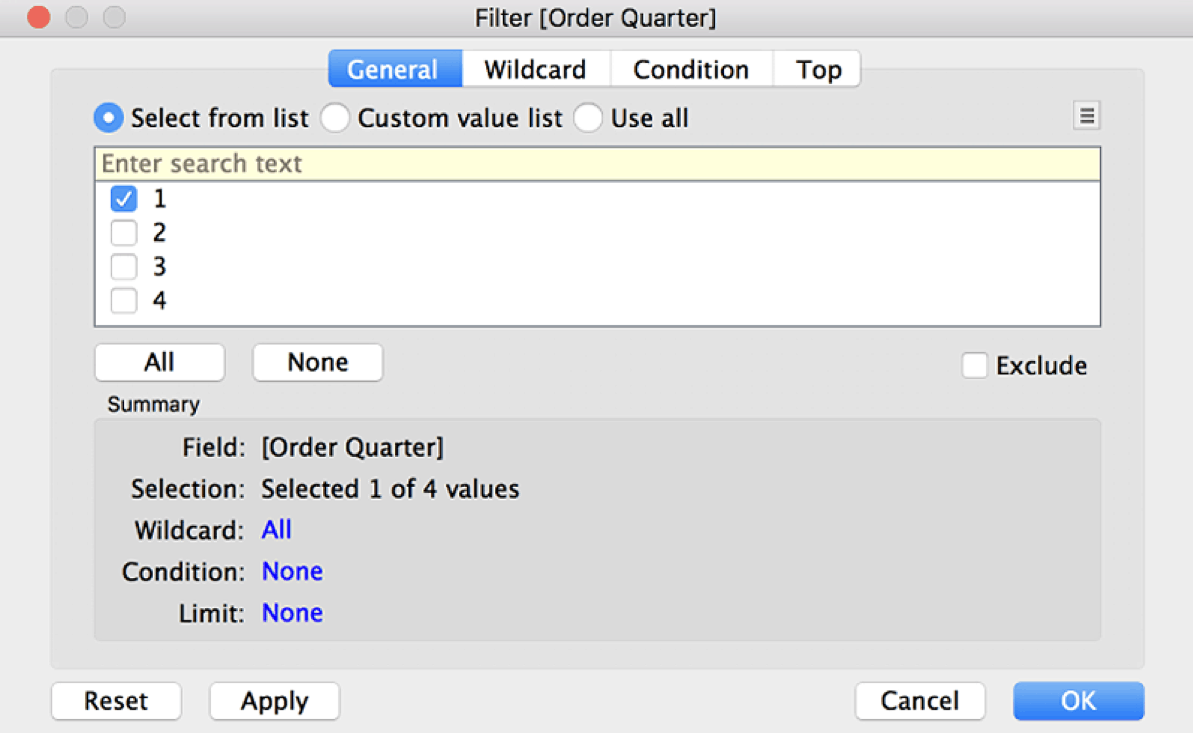
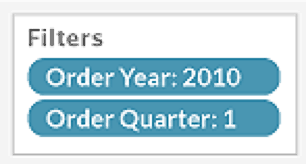
Executing a query for the sum of sales by year and quarter with the above filter results in evaluating 4 CASTs and 1 CONCAT operation for every row. This kind of calculation prevents the SQL engine from partition pruning. Instead, Tableau authors should break the filter up into a Year filter and a Quarter filter— eliminating row level calculations and taking advantage of partition pruning. If your table is partitioned by YearQuarter, then this query will execute much more quickly.
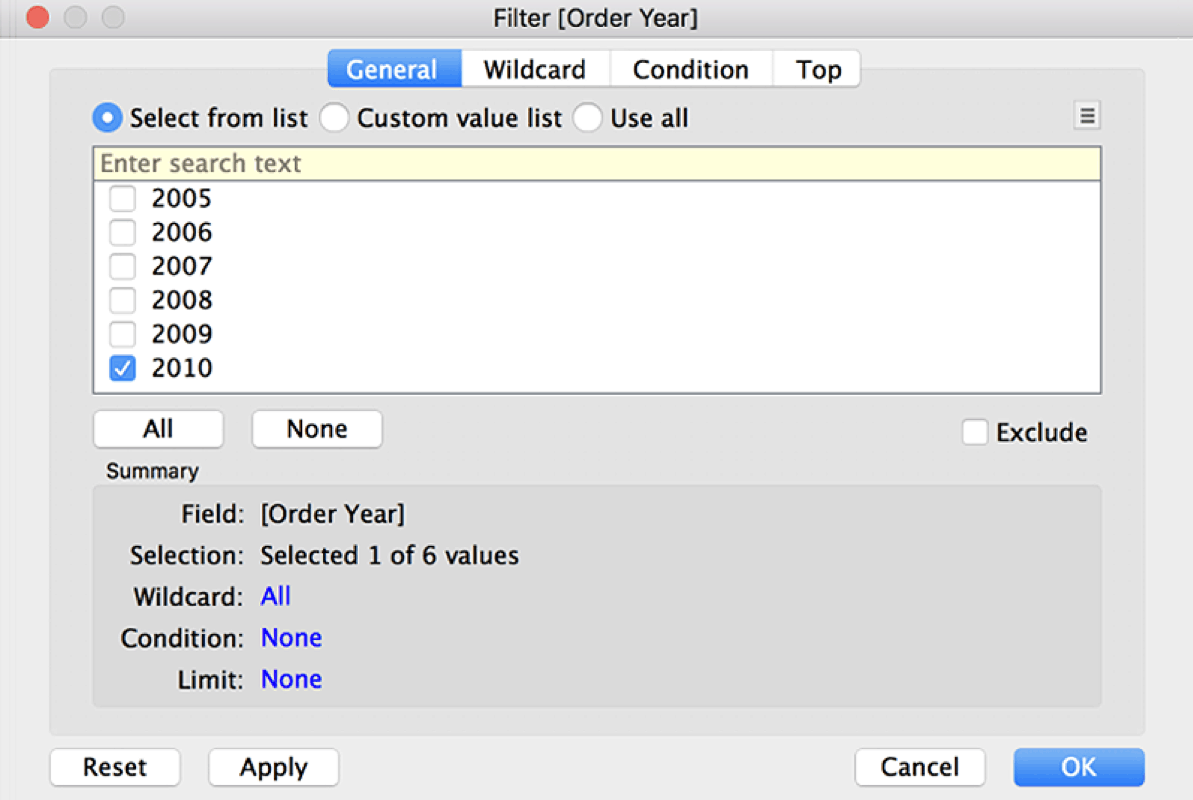
“Partition pruning is an important technique for managing query access times in big data systems. The details of its behavior depend on your data warehouse engine, file format type, block size, and other system configurations. Please check your data warehouse documentation specific to your installation”
Best Practice 2: Measure Tableau’s Concurrent Query Execution

If you have a dashboard that displays lots of visualizations you should use Tableau’s Performance Recording feature to measure the execution time and number of concurrent queries submitted by tableau to render the dashboard. Follow these steps to measure your dashboard’s performance:
- Decide what dashboard you want to analyze
- Open workbook, stop executing queries
- Turn on Performance Recording: Help ⇒ Settings and Performance ⇒ Start Performance Recording
- Navigate to the dashboard of interest
- Refresh the dashboard
- Turn off Performance Recording: Help ⇒ Settings and Performance ⇒ Stop Performance Recording
- Review the Timeline report, looking for queries with a delayed start (see Figure 1)
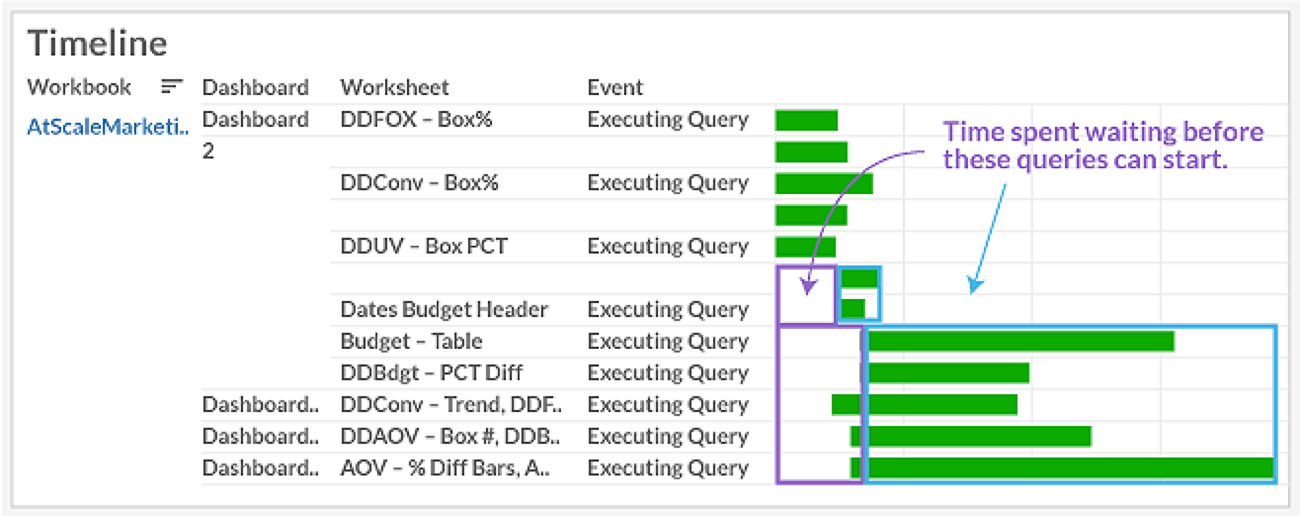 Figure 1. Tableau Timeline Report that Identifies Concurrency Related Wait Time
Figure 1 shows the rendering timeline for a test dashboard. Starting from the top of the chart and reading down, we see that at any given time a maximum of five queries are executing concurrently (i.e. bars overlap). The boxes in red show time spent waiting before the rest of the queries start. The queries in the blue boxes must wait for execution threads to free up before they can even start.
The default number of concurrent Tableau desktop queries is 16 (for Tableau Server, the number is set by your administrator). If your dashboard requires more than the number configured max parallel queries to render, then some of your queries will wait until other queries finish executing. This is a metering feature in Tableau to prevent a few workbook users from overwhelming the database. For information on increasing the number of parallel check out the Tableau Desktop and Tableau Server best practice articles.
Best Practice 3: Tableau’s Automatic Subtotal and Grand Total Features Submit Serialized Queries when Displaying Distinct Count Measures (COUNTD() Aggregation Functions)
Be aware that Tableau’s Automatic Subtotal and Grand Total features submit sequential queries for each subtotal/total level you want to compute if the view includes “Count Distinct” or “Count Distinct Estimate” fields. These sequentially executed queries will slow down worksheet rendering. As of this writing there is no way to force Tableau to execute these queries in parallel. Simply be aware of the load-time cost of this combination of features so that you can design around them if you wish.
Best Practice 4: Understanding How Dimensions and Measures Are Passed From Tableau to Atscale and Affect Performance
Tableau offers different features to allow authors to create the visualizations and interactions they need. These features often affect the performance of the query that Tableau issues to Atscale to retrieve data. In this section, we will review several Tableau features that have an effect on query performance during data retrieval and provide recommendations on how to best optimize your visualization.
FILTERS
With each dimension or measure that is dropped into Tableau’s Filters Card, the field and its values get passed into the the query statement’s WHERE clause. The more dimensions and measures that are added to the filters card, the greater the number of fields the WHERE clause will include.
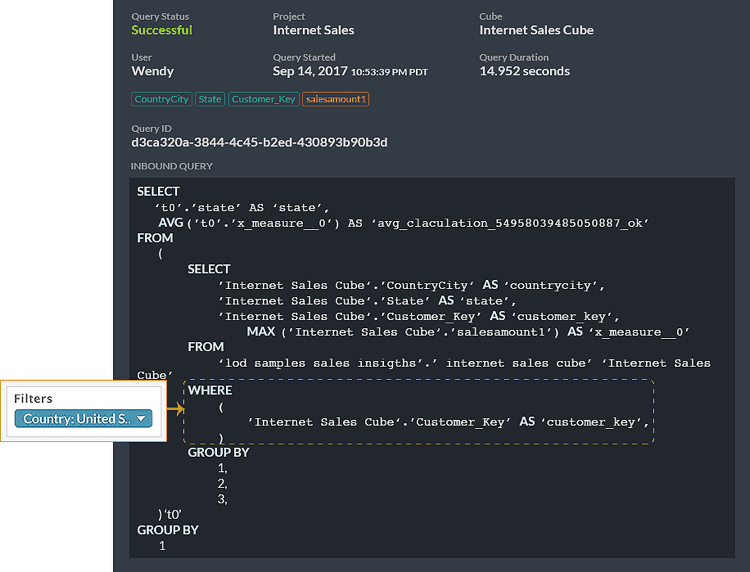
Because the query that Tableau sends back to Atscale can get very complex very quickly depending on the number of dimensions and measures you have added to the Filters card, it is recommended that you simplify your filter selections as much as possible. For example: if you would like to filter on when a particular dimension or measure is true, consider creating a calculation that results in a TRUE/FALSE instead of making selections from a list of values of that particular dimension or measure. Similarly, you should consider using a preprocessed Atscale date dimension (such as Year of Date, Week of Date, etc) when filtering on a particular year, quarter, month, week, or weekday. Calling on Tableau to calculate parts of a date will often generate much more complex queries that will affect query performance (Figure 2)
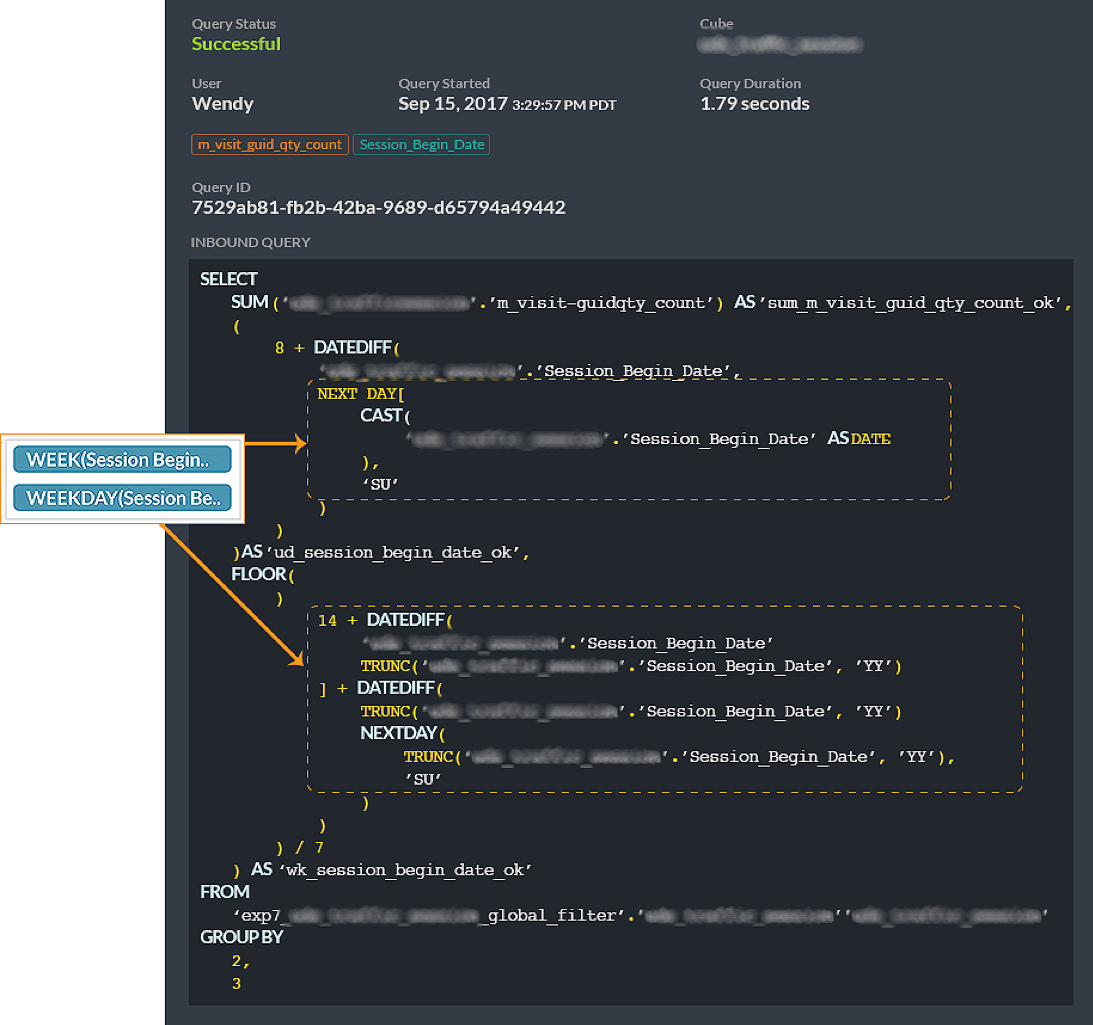 Figure 2. Query complexity when using Tableau to calculate parts of a date (i.e. Week Number and Weekday).
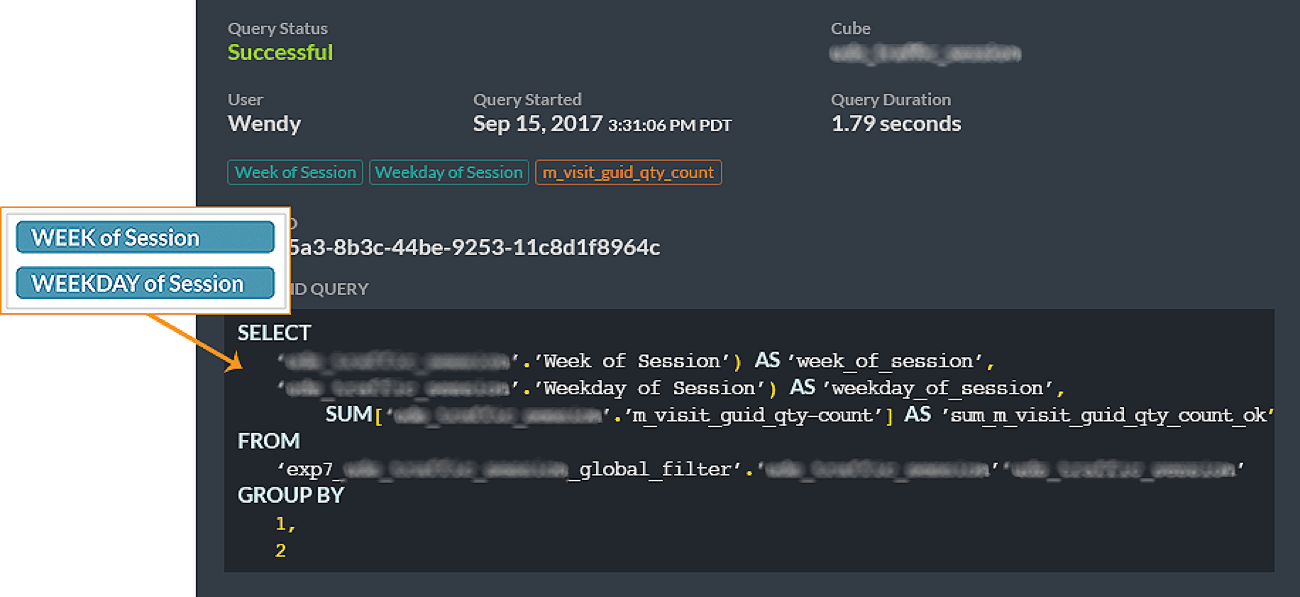 Figure 3: Simplification of query when using preprocessed Atscale date dimensions (i.e. Week of Date, Weekday of Date).
In addition, it is always best practice to evaluate the filters you need to bring into the dashboard.
SORT
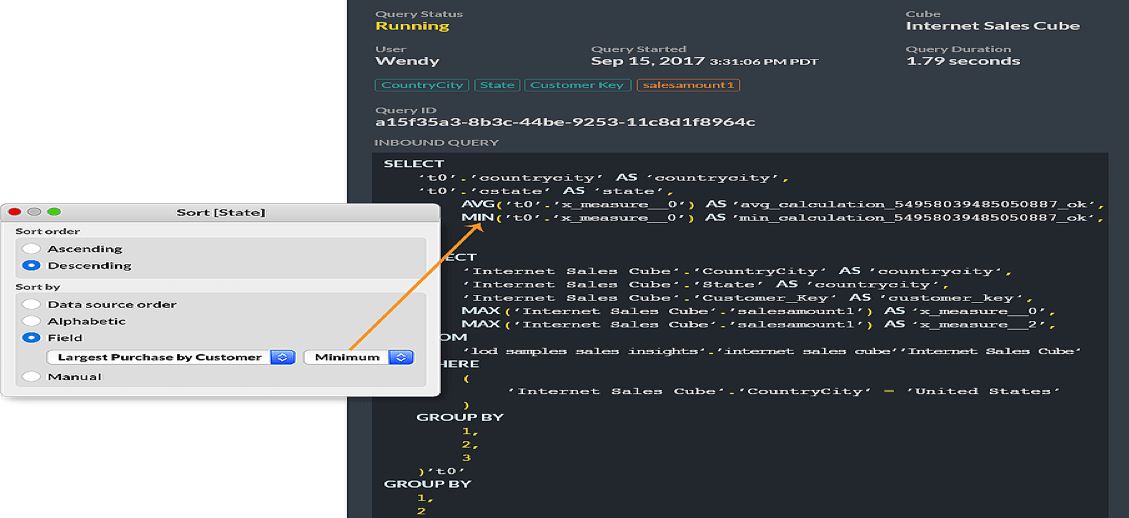
When sorts are applied to dimensions within a Tableau visual, the measure that the sort is also included in the query statement’s SELECT clause that Tableau sends to Atscale. So even though the measure that Tableau is using to sort the visualization on is not explicitly displayed, the measure is still added to the query that is sent to Atscale during data retrieval. The more measure based sort rules that you specify on the visualization’s dimensions, the more measures you end up adding to the query.
PARAMETERS
Measures and dimensions that are called from parameter feature will be added to the “SELECT” clause of the query statement upon usage in the Tableau visualization. The number of measures the query will include is directly dependent on how many are listed in the parameter calculation. By comparison, the dimensional parameter will pass in the particular dimension selected by the user in the parameter.
In the following screenshots (Figure 1), we’ve set up a couple of parameters. One dimensional parameter where it will allow the user to choose a dimension to slice the visualization by. One measure based parameter where it will allow the user to choose the metric to display. When a user interacts with these parameters, the resulting query that is issued includes all of the measures from the measure based parameter calculation and the single dimension selected from the dimensional parameter calculation (Figure 2).
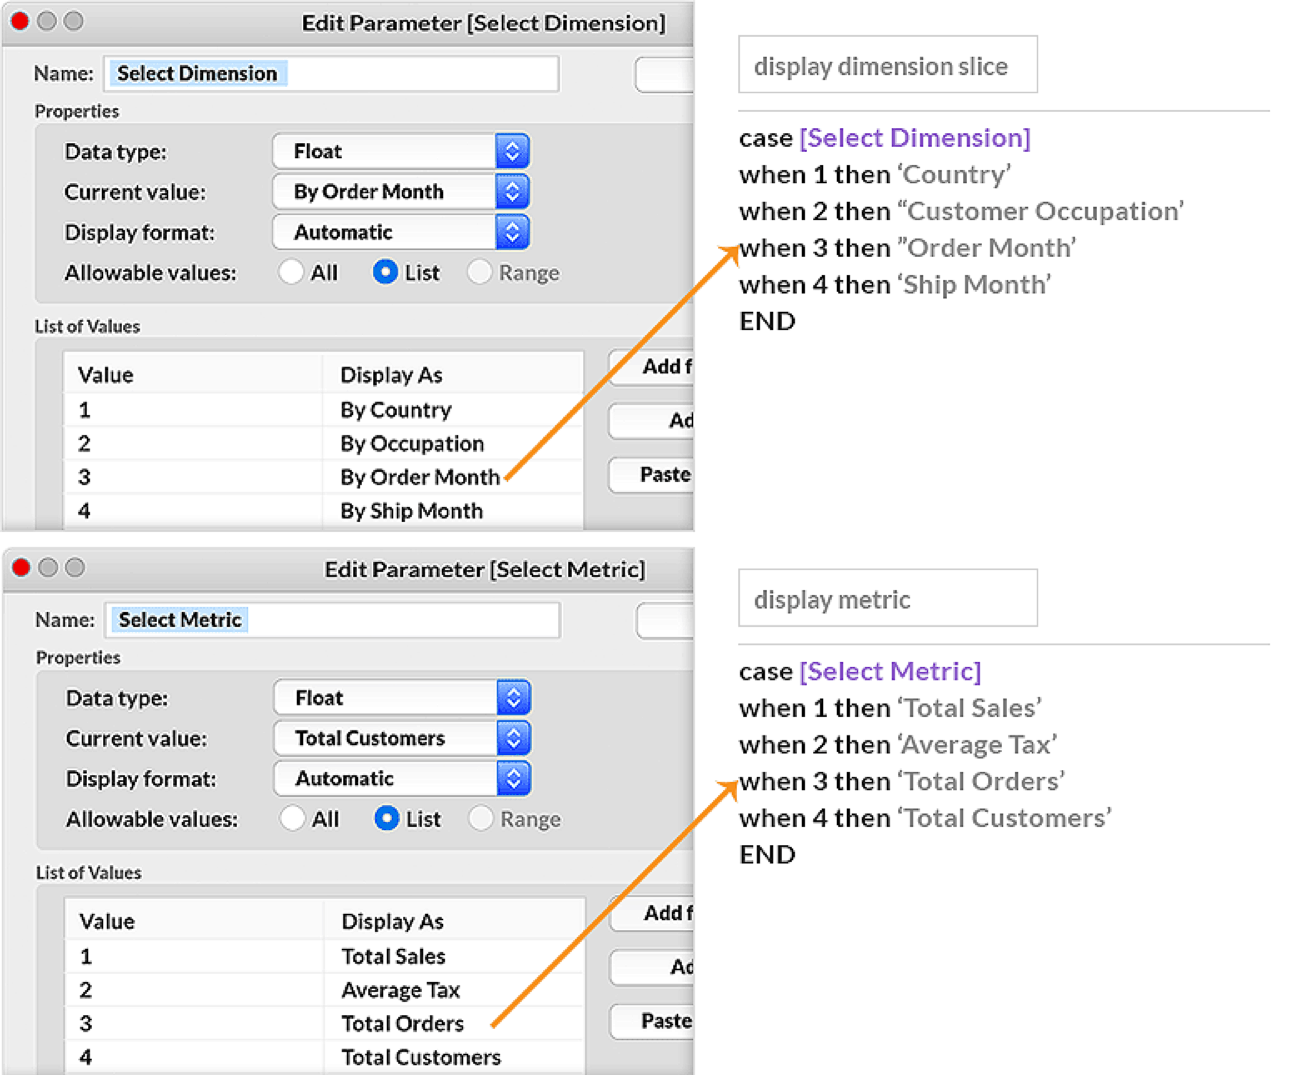 Figure 1: Dimensional and measure parameters and their dependent calculations
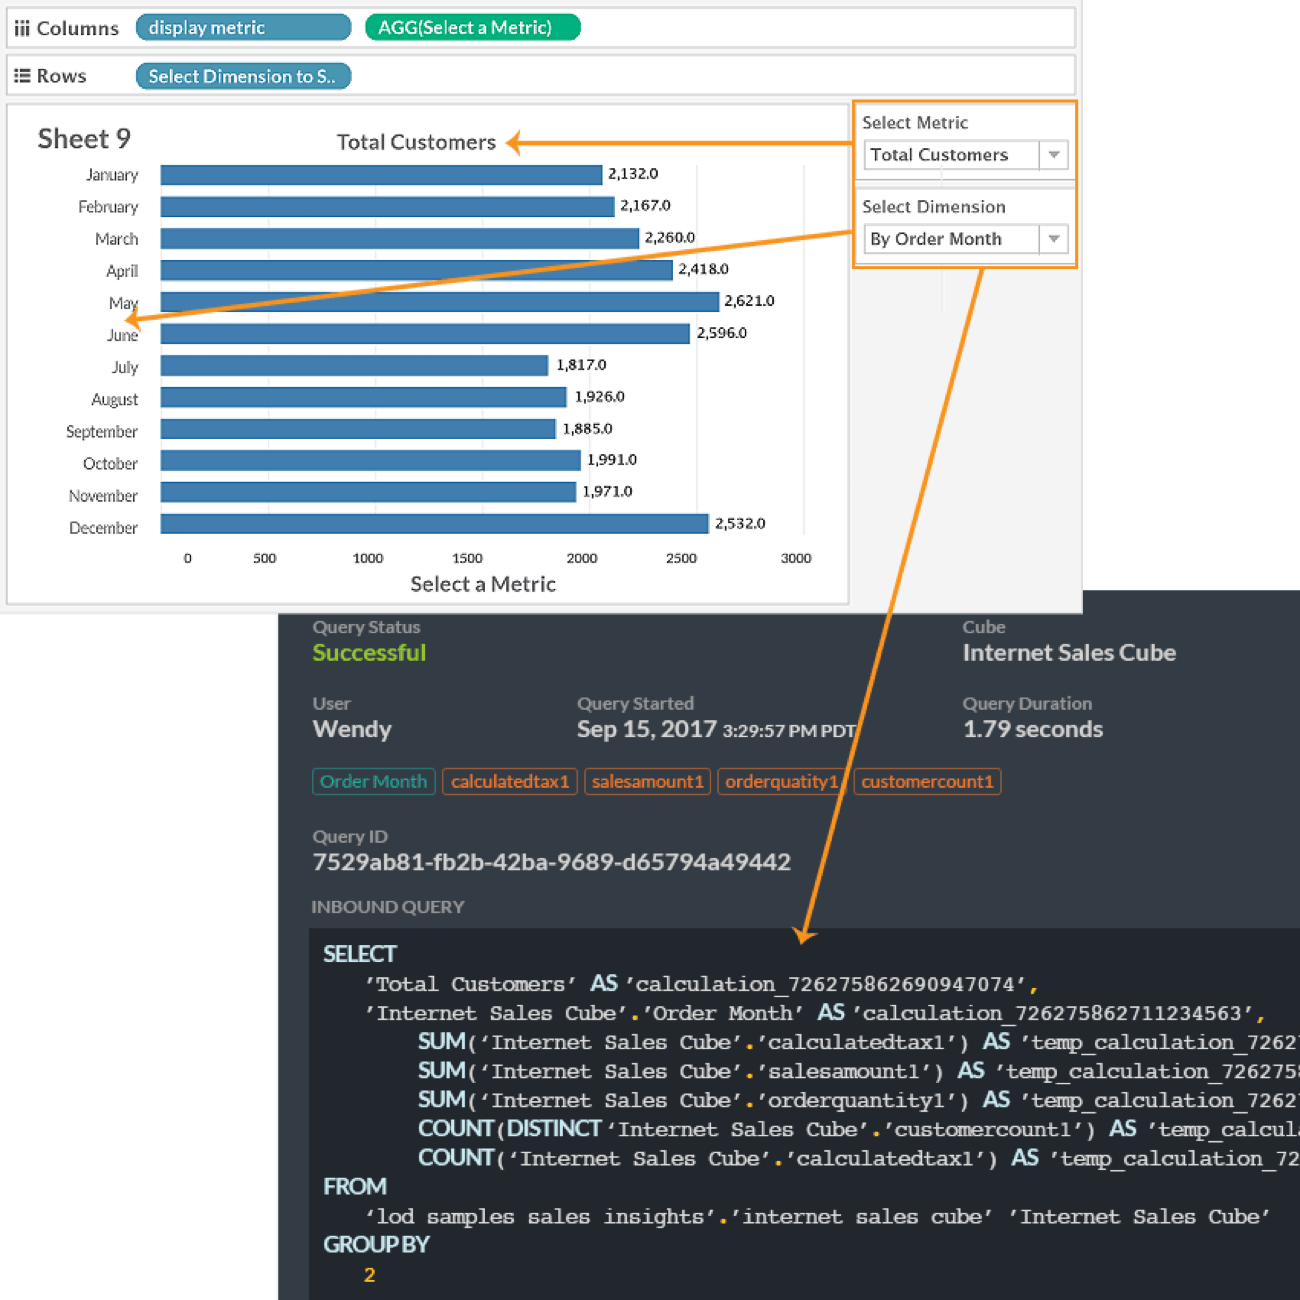 Figure 2: Resulting query statement issued from Tableau and sent to Atscale. Notice the “SELECT” clause. It contains the 4 measures called from the [display metric] parameter calculation and the single selection made from the [display dimension slice] parameter calculation.
Best Practice 5: Use Atscale-created Date Dimensions for better query performance
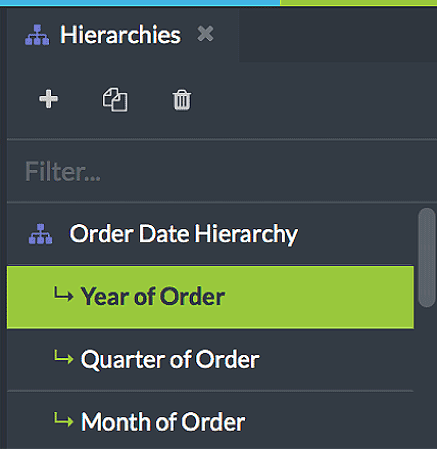
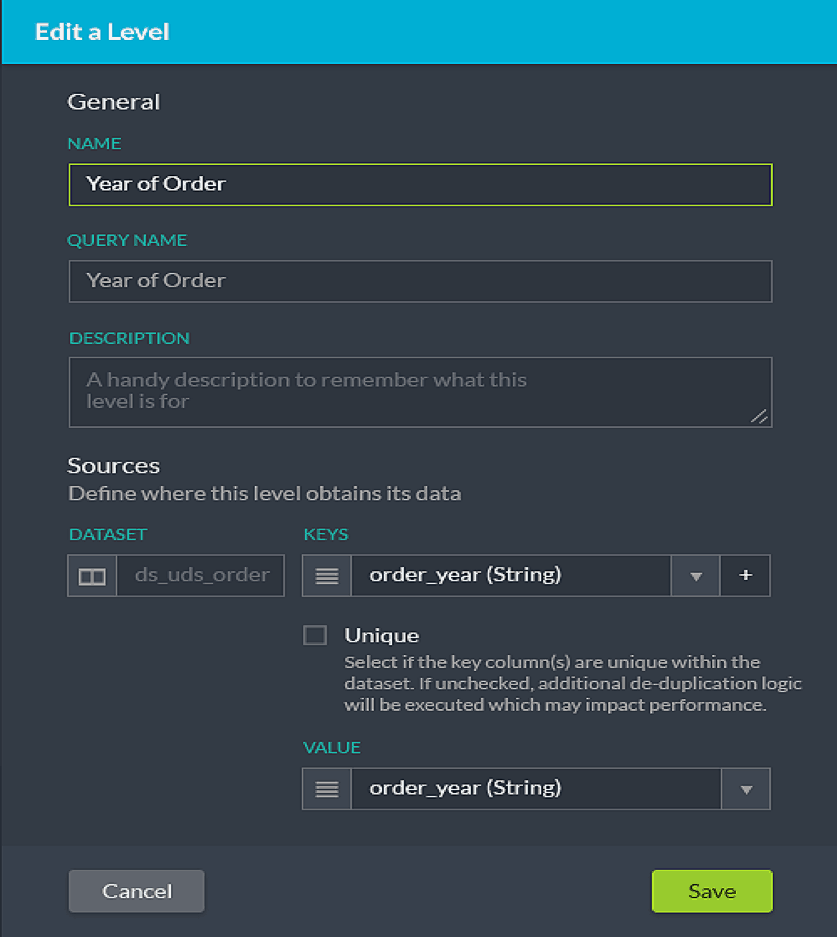
If Date dimension attributes are to be used in filters (i.e, Year = 2016, 2017), you will get better query performance by creating an AtScale dimension from the date field in the fact table, versus using Tableau’s built-in time intelligence features. The example below uses the Order Date from the fact table and creates a hierarchy, with attributes for Year, Month and Day.
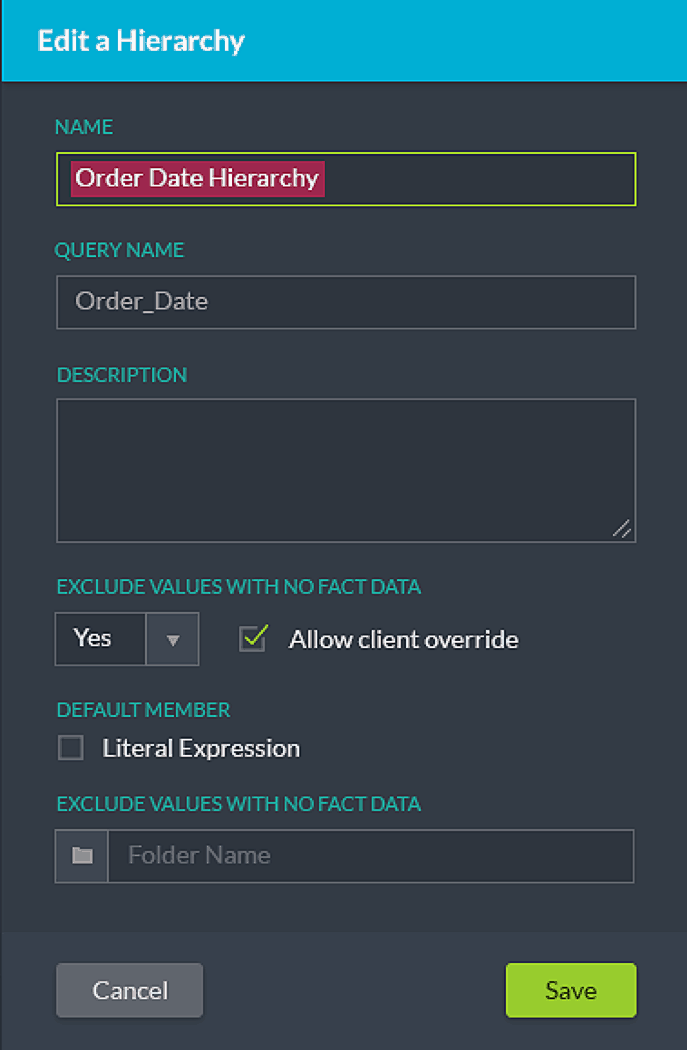
In Tableau, the Order Date Hierarchy appears in the Dimension pane and looks like this:
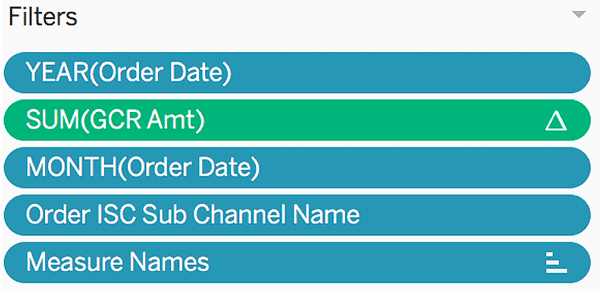
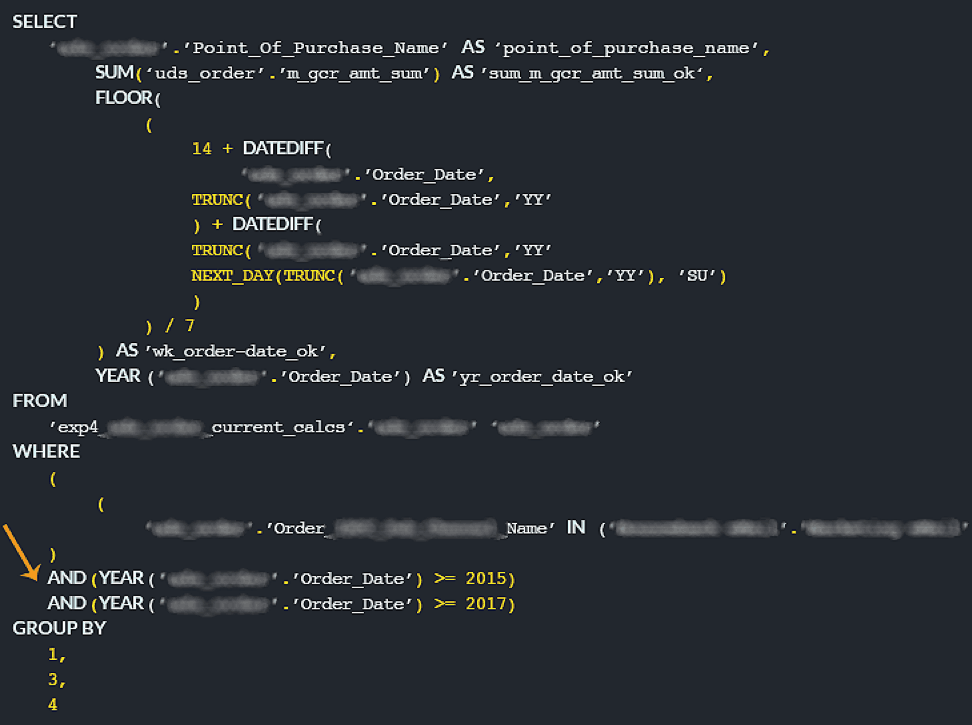
It is common practice for the Tableau author to drag and drop the “Order Date” field from the dimension pane to the filter and select the YEARS part if the user wants to filter the data between the years 2015-2017. While this still works when Tableau is connected to AtScale, the resulting query that Tableau sends to AtScale will contain a sub-optimal WHERE clause in the query statement.
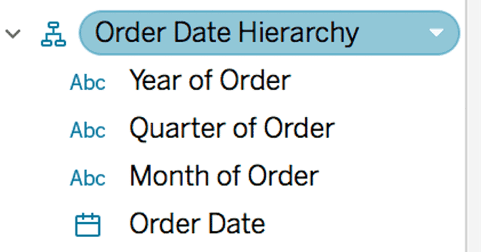
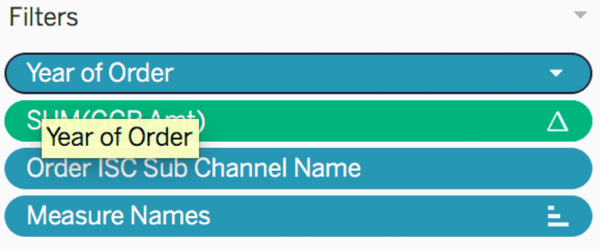
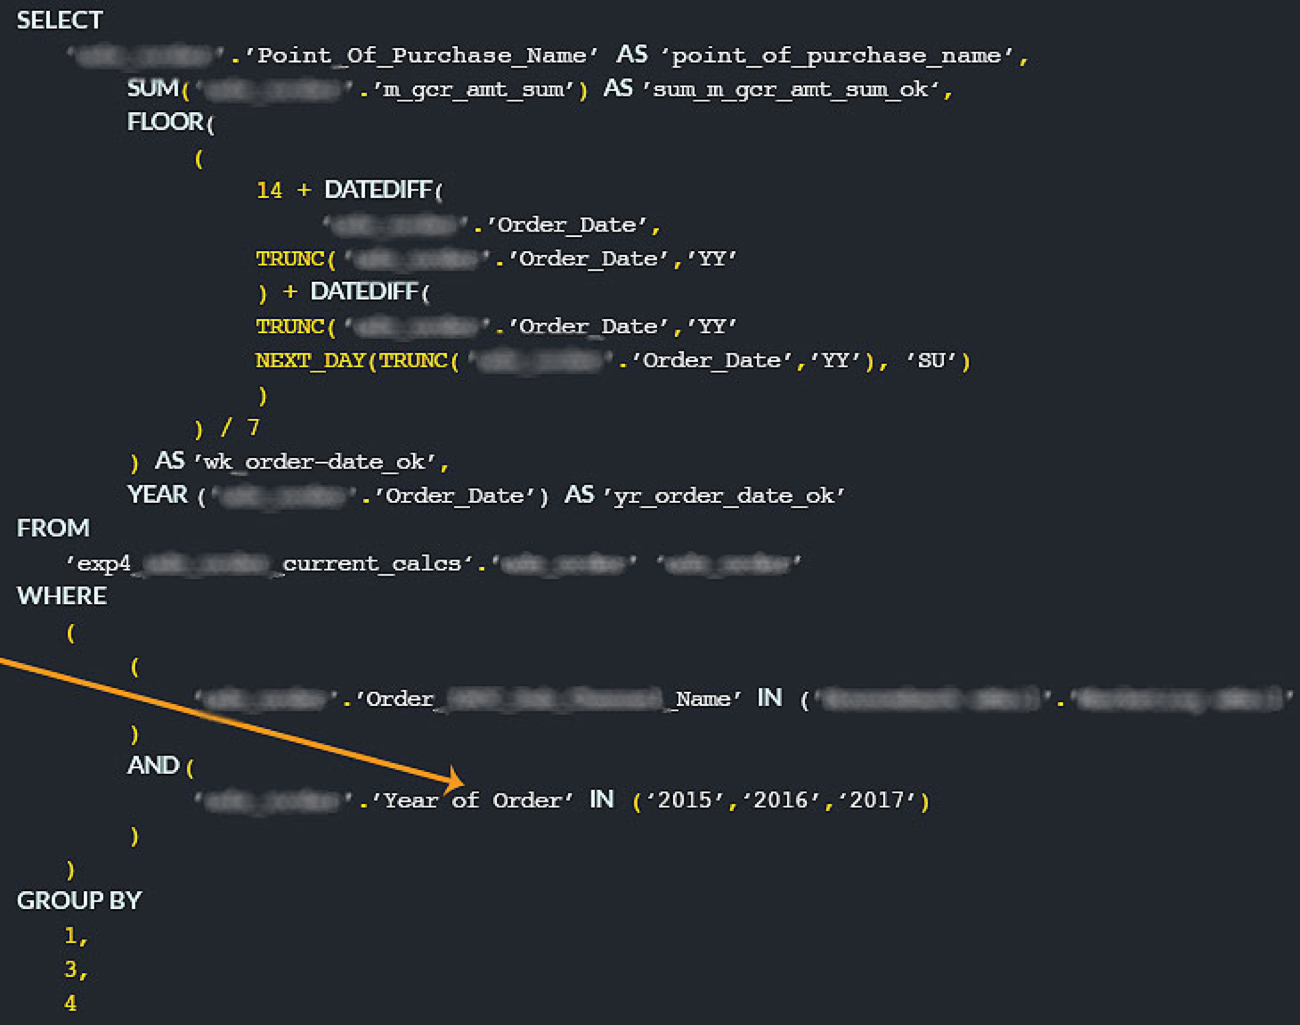
As an alternative, the cube designer can pre-process the YEAR from the Order Date (Year of Order) and make it available as a dimension for the Tableau author to use directly. The “Year of Order” dimension in the filter shelf will present a much cleaner WHERE clause in the query statement.
Join Jen Underwood to Learn Best Practices on Deploying Data Analytics Strategy
We hope this set of best practices help you gain immediate value from all the capabilities that AtScale offers as the industry’s most robust and scalable business interface for big data. Stay tuned for more!
We invite you to learn more about AtScale today!


SHARE
Guide: How to Choose a Semantic Layer