
If you are like me, a Tableau fan, you’ve probably used Tableau for many years, attended numerous Tableau Conferences, and cheered with great enthusiasm when the engineers at Tableau demonstrated the latest and greatest enhancements to the software. You may also be very accustomed to creating your own calculations based on the row level data you are connected to. You enjoy the freedoms that Tableau offers.
Increasing your Efficiency and Effectiveness
If you are like me, you enjoy knowing that you can turn around useful dashboards to your business teams quickly. You know you can deliver changes on the fly (even during meetings) when you use Tableau. It is your “secret sauce”, your go to BI tool when you need to deliver a dashboard that is both visually appealing AND insightful. Tableau makes you feel empowered, efficient and effective.
On the other side of the spectrum, how many times have you had to go into multiple workbooks or published Tableau data sources to change the logic used for particular calculations due to the changing needs of the multiple business teams you support? How much time have you spent updating your individual files? Again, if you are like me, it is probably more often than you want to quantify.
While custom dashboards for each individual team within a business unit may be necessary, analysts often encounter problems of custom metric logic that are not always understood across teams. In larger meetings, teams may spend more time explaining the differences between two dashboards than actually gaining understanding of what the data is saying. Even less time is then spent on what business decision needs to be made based on this data. I know this path all too well and have encountered many very experienced Tableau authors who have as well.
In conversations with my fellow Tableau authors, we all recognize the need for a semantic layer like AtScale – particularly in discussions around upcoming migration projects. These types of discussion are quite often met with heavy sighs as we all know how much work will be involved to update each and every workbook affected. As dashboard designers, the updates to the workbooks are never straight forward. We look for ways to improve our designs too. Hence, the scope and level of effort on the migration project increases exponentially. We talk about these projects like our rite of passage and wear each one as a badge of honor. For the many workbook migration projects I have been on, I have learned from each one and refined the process of the next to make my and that of my team’s lives simpler.
There are many tasks that a Tableau author to take care of during workbook migration projects, such as workbook, dashboard, metric depreciation and standardization, and design improvements. Metric standardization is where AtScale enters for me. A semantic layer solution that will solve the pain of swimming in a sea of custom metric logic and truly unify a single pane view of business metrics from the executives to the individual contributors. However, Tableau authors tend to shy away from a semantic layer because they often perceive it as they are somehow giving up the Tableau “freedom” of creating your own custom calculations. This is definitely a misperception because the semantic layer offers you the freedom of time to focus on being even more effective and efficient with Tableau.
The combination of Tableau and AtScale make a great solution because it offers you, as a Tableau author, the best of both worlds. You retain the functionalities of Tableau AND gain the advantage of leveraging AtScale as a semantic layer. Below are some considerations to help you understand why.
Efficiency Considerations
When migrating existing Tableau workbooks to AtScale, metric standardization is key to alleviating the pain of updating each workbook one at a time. The work to evaluate all calculations contained within the workbooks be as candidates for bringing into AtScale must be done. It is also important to understand that when performing at live connection to a data source, Tableau sends all Tableau calculations, field requests back to the database when it is a live connect to the data source. So all data type conversions, function calls, filter selections, constraint based calculations, etc are all translated into query form by Tableau and passed to AtScale for processing. If you use nested calculations where one Tableau calculation is leveraging the results of another Tableau calculation, the resulting query that Tableau generates could be quite large and complex (Figure 1).
For example: The Tableau calculation for “TrendDate” leverages 2 additional Tableau calculations (“CurrentMonday” and “MonToSunWeek”):
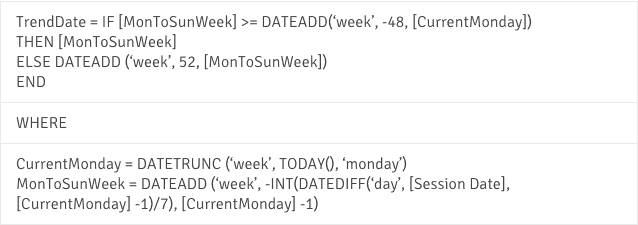
The “TrendDate” is an look back on 8 weeks based on finding the “CurrentMonday” for the current week and the week set to a “MonToSunWeek” week.
Figure 1 shows the resulting query statement issued from Tableau and sent to Atscale. Notice the “SELECT” clause. It contains the 4 measures called from the [display metric] parameter calculation and the single selection made from the [display dimension slice] parameter calculation. Doing all of these calculations in Tableau forces Tableau to include these calculations in the query that AtScale receives.
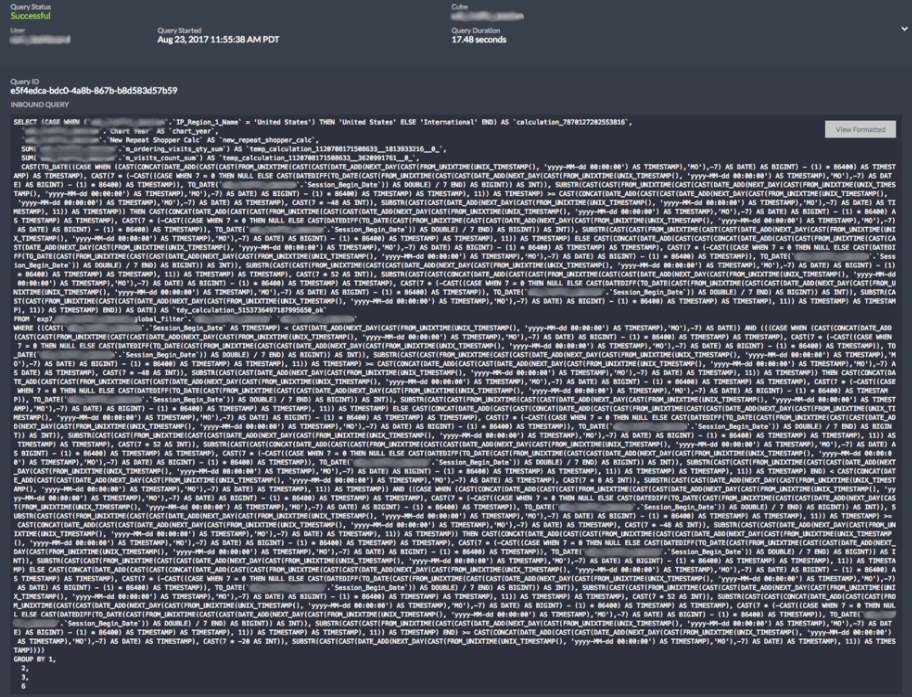 Figure 1. This complex nested SQL query is generated as a result of nested date calculations that are coming from Tableau.
The resulting query completes in about 18 seconds to retrieve 8 weeks worth of data on a small sample data set of about 100K rows. This is after an aggregate table has been created. If there was not an aggregate table present for this query, the query duration is exponentially longer (about 6-12 minutes). In this situation and given the performance of the query, these Tableau calculations would be great candidates for bringing into AtScale. When you bring calculations into the semantic layer, they are pre-calculated. Tableau simply executes the query to request the data from the dimension or measure field rather than executing a query that includes embedded calculations. If the goal of the workbook migration project is to productionize Tableau workbooks, the performance gains you receive when you bring all or part of these Tableau calculations to AtScale cannot be ignored.
Guidelines to Help You Decide Your Effectiveness and Efficiency
Here are some consideration guidelines to help you determine which approach best fits your business needs :
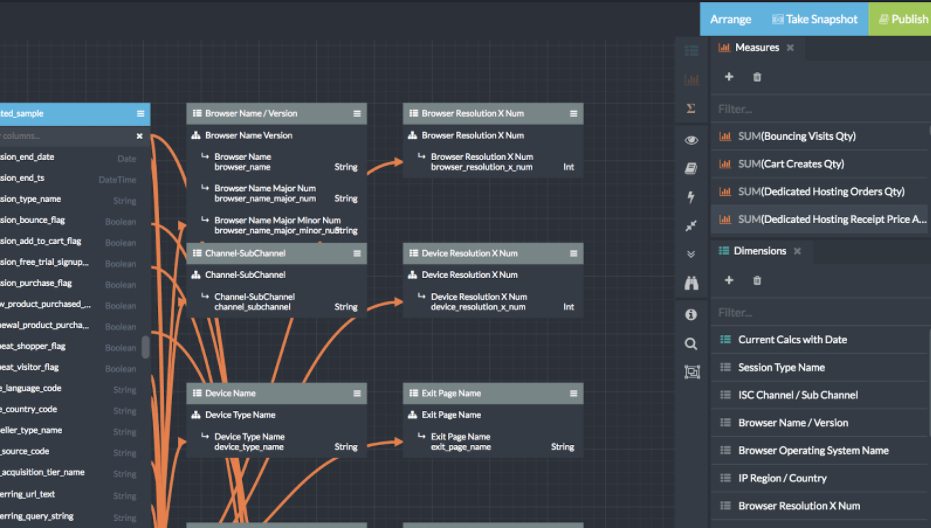
Below is a partial screenshot of the fully scalable AtScale model that addresses the complex query from Figure 1 in addition to other use cases.
- Is this a metric logic that more than one/most/all business team(s) can potentially leverage?
If so, standardization of the metric logic would be a best practice for your organization. In our sample case, “TrendDate” is leveraged by many workbooks and different teams. So it would make sense for the calculation and its dependent calculations (“CurrentMonday” and “MonToSunWeek”) to be brought into Atscale. This would not only provide standardization of metric logic but also reduce the query complexity and improve performance of the query (Figure 2).
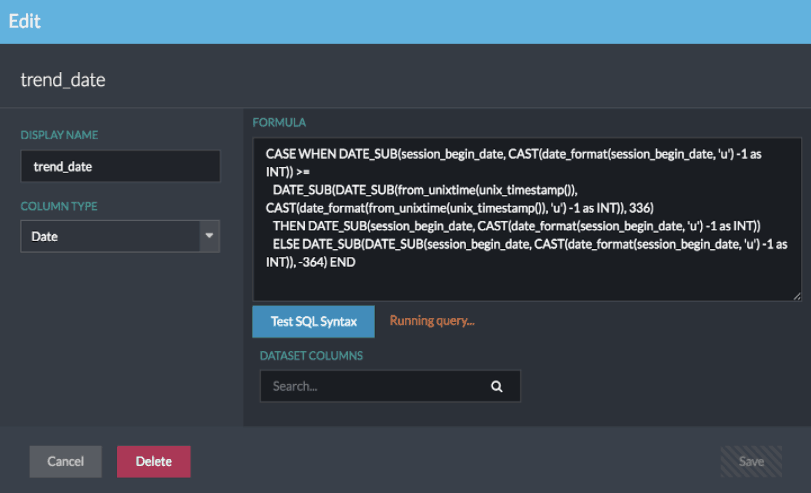
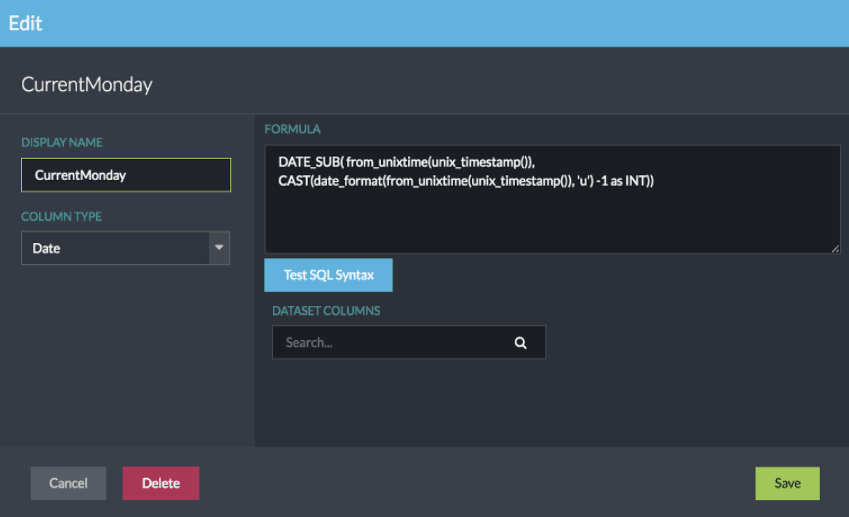
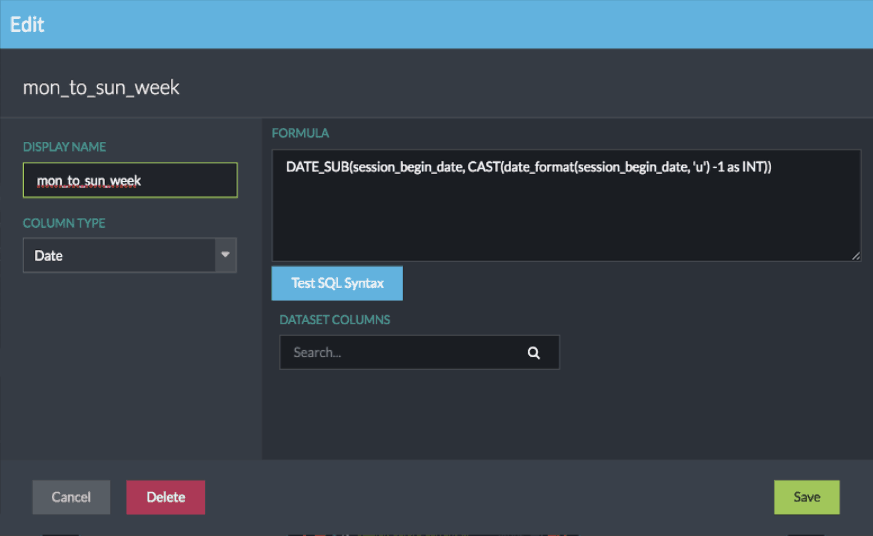
You may create “TrendDate”, “CurrenMonday” and “MonToSunWeek” as calculated columns within AtScale that may be used across the business units. This saves time and effort in managing your corporate standardized business logic for metrics.
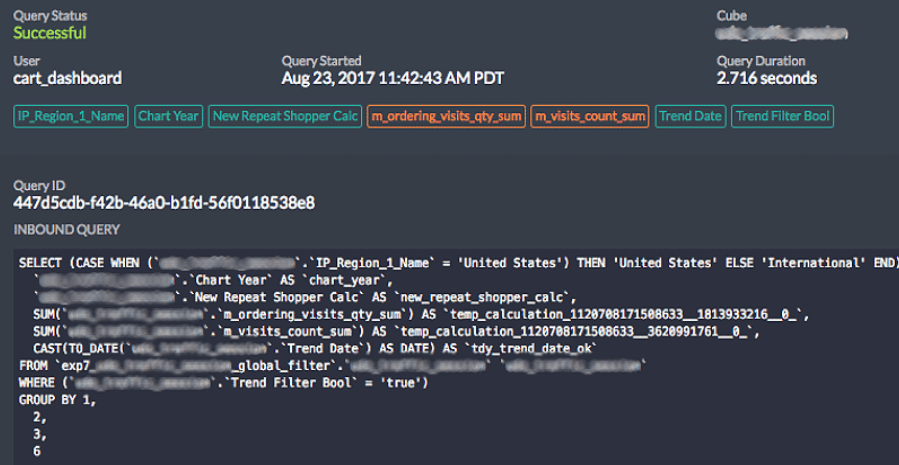 Figure 2. “TrendDate”, “CurrentMonday” and “MonToSunWeek” calculations are standardized in AtScale. The resulting query run time is reduced from 18 seconds to about 2.7 seconds.
Notice that the “TrendDate” dimension has been referenced in the query screen within AtScale. This indicates that the query is now using the “TrendDate” calculated column from AtScale instead of running a date calculation within the query to find the “TrendDate”.
- Do you need flexibility on your primary calculation and still want improved query performance?
If so, then a compromise is your best practice. In our sample case, our business users wanted to be able to specify custom number of week that “TrendDate” looks back. In this situation, the best practice would be to consider a hybrid approach in calculating “TrendDate”. Bringing in the dependent calculations of “CurrentMonday” and “MonToSunWeek” will allow Tableau authors the flexibility to determine and change their look back week on “TrendDate” and still retain improved query performance (Figure 3). Notice in the screenshot below that “TrendDate” is no longer listed as a dimension as compared to Figure 2.
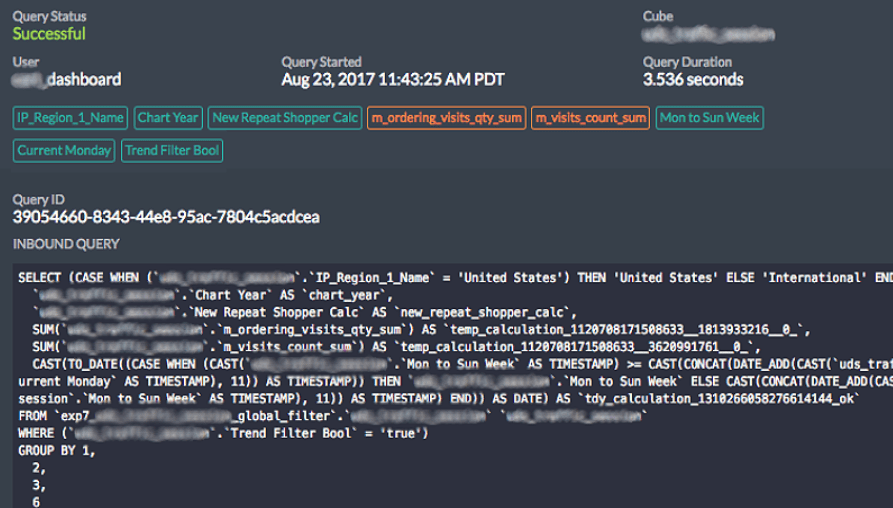 Figure 3. CurrentMonday” and “MonToSunWeek” calculations are standardized in Atscale and “TrendDate” is a Tableau calculation being passed over in the query to Atscale. Notice the resulting query run time of 3.5 seconds is a reduction from the original 18 seconds but only slightly higher than the 2.7 seconds from Figure 2.
- Do you need complete flexibility for testing new metric logic?
If so, then the approach to build custom Tableau calculations is the better approach so you can change the metric logic as often as you need. Once you have a finalized metric logic that is ready for production, you may then bring it into AtScale using either approach 1 or approach 2 (as described above).
The combination of Tableau and AtScale offers you the best of both worlds. You retain the functionalities of Tableau AND gain the advantage of leveraging AtScale as a semantic layer. As a Tableau author, the use of the AtScale semantic layer as your data source will increase your effectiveness and efficiency. If you would like to learn more, please visit our product page or request a demo.


SHARE
Guide: How to Choose a Semantic Layer