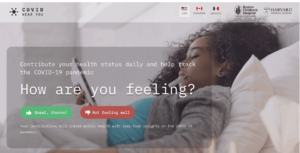
Created by experts at Boston Children’s Hospital and Harvard Medical School, COVIDNearYou.org collects input from people feeling healthy (and finds out whether they have received or plan to receive a flu vaccine), and from those not feeling well, asking for details about their symptoms and other related information.

To help make this crowdsourced data available for real-time analysis by public health officials and policy makers, they recently partnered with AtScale, a provider of intelligent data virtualization solutions, which is offering free access to its Cloud OLAP Model and Tableau, the the leading analytics platform, for data visualization, allowing public health agencies to drill into the data and gain fresh insights in real time.
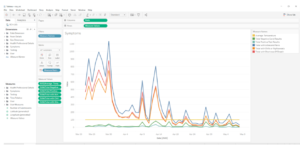
Here is an example of how covidnearyou.org tracks data such as average temperature, shortness of breath and COVID-19 positive test results with an AtScale data model shown with a data visualization using Tableau.

Here are three ways to get involved and learn more:
- Visit covidnearyou.org and self-report
- Request access to the AtScale COVID Near You data model: atscale.com/covidnearyou
- Register now to join experts from Boston Children’s Hospital, Harvard Medical School, AtScale and Tableau on a live webinar on Tuesday, May 26th @ 12:00 PM PT/3:00 PM ET as they explain how public health officials are analyzing thousands of reports and map them to generate local and national views of COVID-like-illness.
Together, we can provide public health officials and researchers with real-time data that could help end the COVID-19 pandemic, and prevent the next one from happening.


SHARE
Case Study: Vodafone Portugal Modernizes Data Analytics